4.Taking a Measurement
5.Check the measurement results.
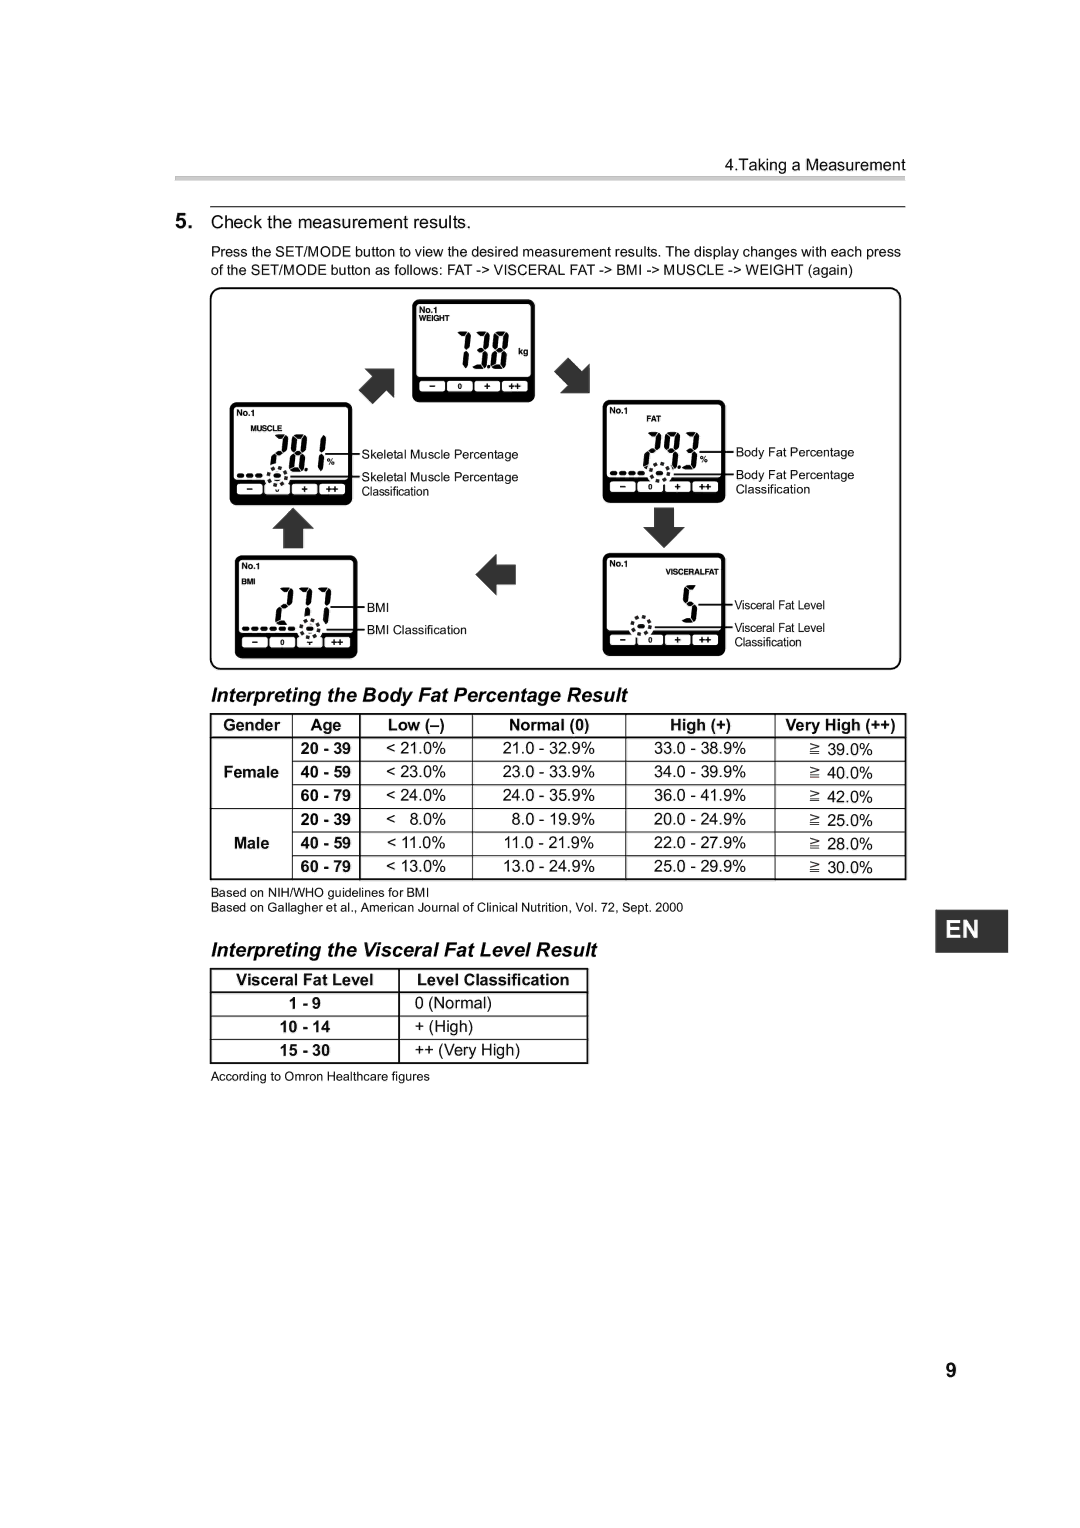
Press the SET/MODE button to view the desired measurement results. The display changes with each press of the SET/MODE button as follows: FAT
Skeletal Muscle Percentage |
|
|
|
| Body Fat Percentage |
|
|
|
| ||
Skeletal Muscle Percentage |
|
|
|
| Body Fat Percentage |
|
|
|
| ||
Classification |
|
|
|
| Classification |
|
|
|
|
|
|
BMI |
| Visceral Fat Level | |
| |||
BMI Classification |
|
| Visceral Fat Level |
|
| ||
|
|
| Classification |
Interpreting the Body Fat Percentage Result
Gender | Age | Low | Normal (0) | High (+) | Very High (++) | |
| 20 - 39 | < 21.0% | 21.0 | - 32.9% | 33.0 - 38.9% | _ |
| > 39.0% | |||||
Female | 40 - 59 | < 23.0% | 23.0 | - 33.9% | 34.0 - 39.9% | _ |
> 40.0% | ||||||
| 60 - 79 | < 24.0% | 24.0 | - 35.9% | 36.0 - 41.9% | _ |
| > 42.0% | |||||
| 20 - 39 | < 8.0% | 8.0 | - 19.9% | 20.0 - 24.9% | _ |
| > 25.0% | |||||
Male | 40 - 59 | < 11.0% | 11.0 - 21.9% | 22.0 - 27.9% | _ | |
> 28.0% | ||||||
| 60 - 79 | < 13.0% | 13.0 | - 24.9% | 25.0 - 29.9% | _ |
| > 30.0% | |||||
Based on NIH/WHO guidelines for BMI
Based on Gallagher et al., American Journal of Clinical Nutrition, Vol. 72, Sept. 2000
Interpreting the Visceral Fat Level Result
Visceral Fat Level | Level Classification | |
1 | - 9 | 0 (Normal) |
10 | - 14 | + (High) |
15 | - 30 | ++ (Very High) |
According to Omron Healthcare figures
EN
9