USING THEIITLEPRINTER
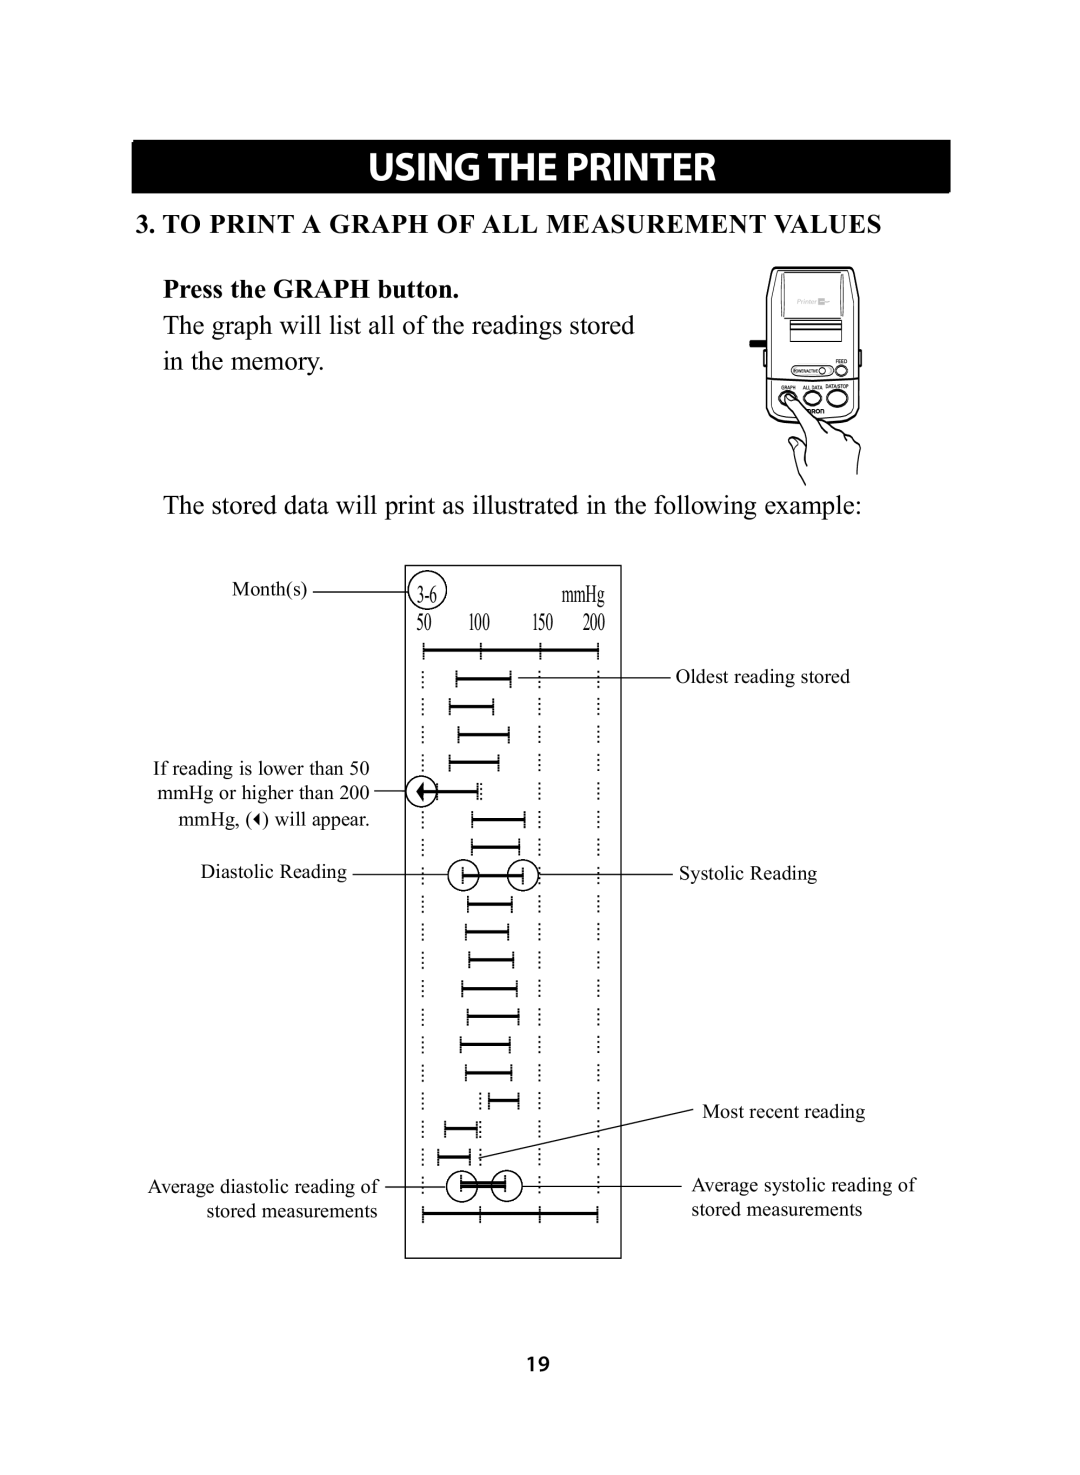
3. TO PRINT A GRAPH OF ALL MEASUREMENT VALUES
ThePr ssgraphthe GRAPHwill list allbuttonof the. readings stored in the memory.
The stored data will print as illustrated in the following example:
Month(s) | 100 | 150 | mmHg | |
| 50 | 200 | ||
|
|
|
| Oldest reading stored |
If reading is lower than 50 |
|
|
|
|
mmHg or higher than 200 |
|
|
|
|
mmHg, (3) will appear. |
|
|
|
|
Diastolic Reading |
|
|
| Systolic Reading |
|
|
|
| Most recent reading |
Average diastolic reading of |
|
|
| Average systolic reading of |
stored measurements |
|
|
| stored measurements |
|
|
| 19 |
|
