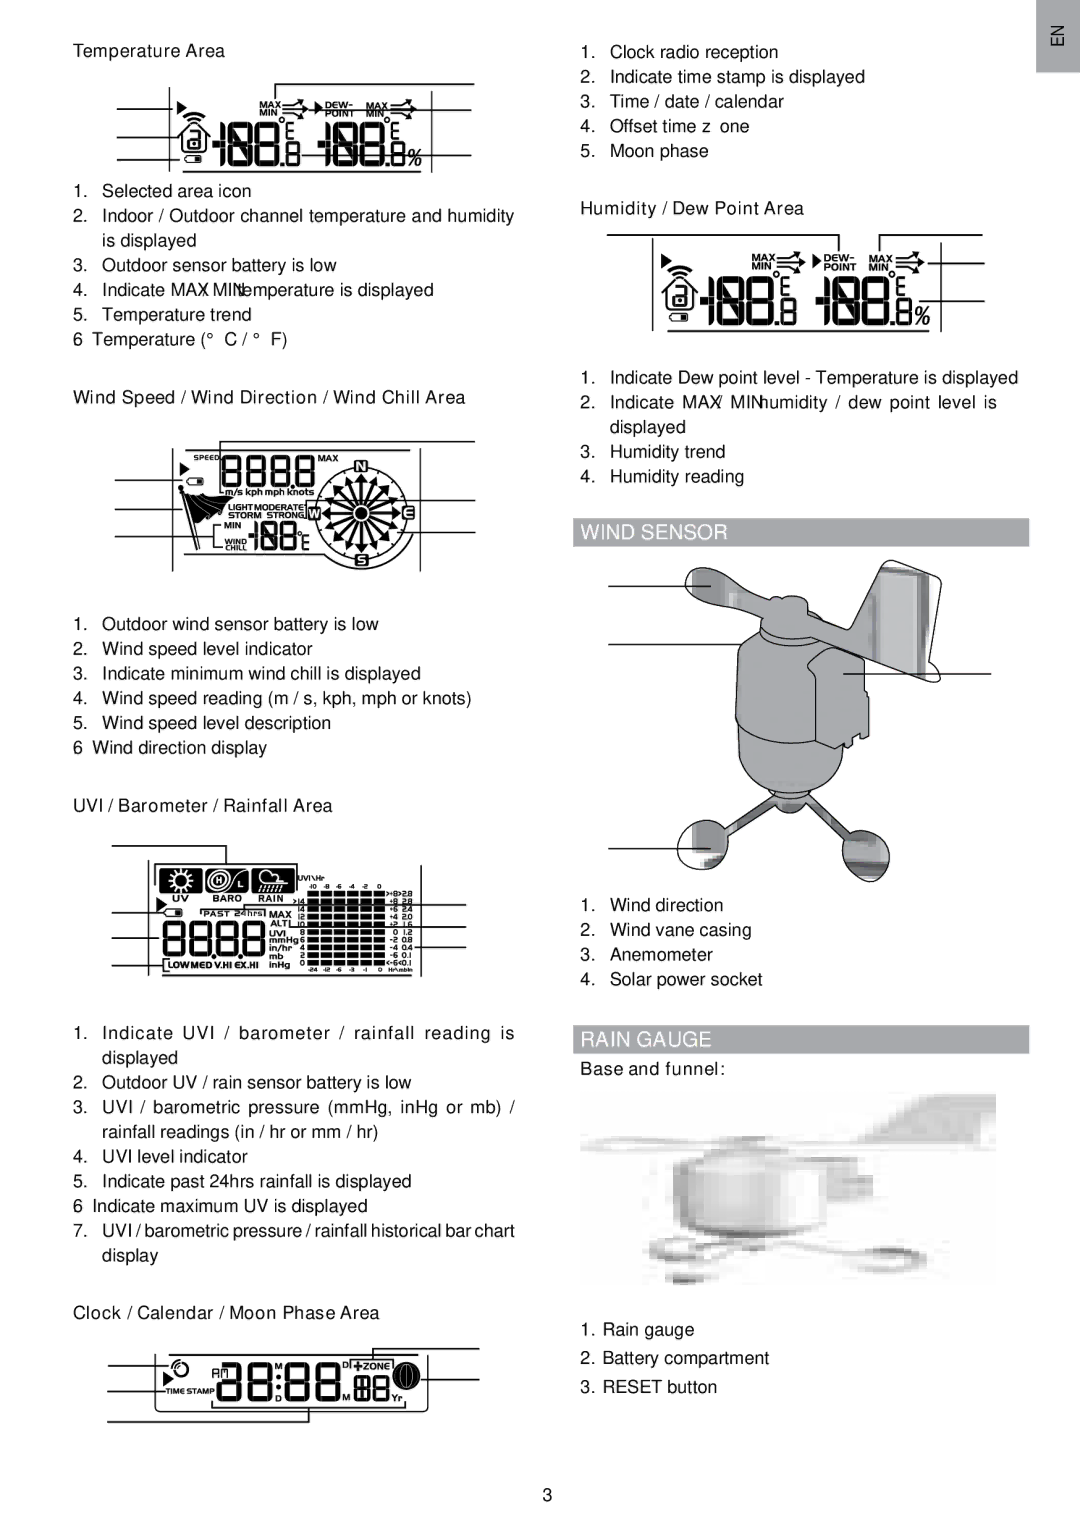
Temperature Area |
|
|
| ||||||||
1 |
|
|
|
|
|
|
|
|
|
| 4 |
|
|
|
|
|
|
|
|
| 5 | ||
|
|
|
|
|
|
|
| ||||
|
|
|
|
|
|
|
|
| |||
2 |
|
|
|
|
|
|
|
|
| 6 | |
|
|
|
|
|
|
|
|
| |||
3 |
|
|
|
|
|
|
|
|
| ||
|
|
|
|
|
|
|
|
| |||
|
|
|
|
|
|
|
|
| |||
1.Selected area icon
2.Indoor / Outdoor channel temperature and humidity is displayed
3.Outdoor sensor battery is low
4.Indicate MAX / MIN temperature is displayed
5.Temperature trend
6.Temperature (°C / °F)
Wind Speed / Wind Direction / Wind Chill Area
| 4 |
1 |
|
2 | 5 |
| |
3 | 6 |
1.Outdoor wind sensor battery is low
2.Wind speed level indicator
3.Indicate minimum wind chill is displayed
4.Wind speed reading (m / s, kph, mph or knots)
5.Wind speed level description
6.Wind direction display
UVI / Barometer / Rainfall Area |
| |
1 |
| |
2 | 5 | |
6 | ||
3 | ||
7 | ||
4 | ||
|
1.Indicate UVI / barometer / rainfall reading is displayed
2.Outdoor UV / rain sensor battery is low
3.UVI / barometric pressure (mmHg, inHg or mb) / rainfall readings (in / hr or mm / hr)
4.UVI level indicator
5.Indicate past 24hrs rainfall is displayed
6.Indicate maximum UV is displayed
7.UVI / barometric pressure / rainfall historical bar chart display
Clock / Calendar / Moon Phase Area
1 | 4 | |
5 | ||
2 | ||
| ||
3 |
|
1. | Clock radio reception |
|
|
|
| EN | |
|
|
|
|
| |||
2. | Indicate time stamp is displayed |
|
|
|
|
| |
|
|
|
|
| |||
3. | Time / date / calendar |
|
|
|
|
| |
4. | Offset time zone |
|
|
|
|
| |
5. | Moon phase |
|
|
|
|
| |
Humidity / Dew Point Area |
|
|
|
|
| ||
1 |
|
|
|
| 2 |
| |
|
|
|
|
| |||
|
|
|
|
| 3 |
| |
|
|
|
|
| |||
4
1.Indicate Dew point level - Temperature is displayed
2.Indicate MAX / MIN humidity / dew point level is displayed
3.Humidity trend
4.Humidity reading
WIND SENSOR
1
2
4
3
1.Wind direction
2.Wind vane casing
3.Anemometer
4.Solar power socket
RAIN GAUGE
Base and funnel:
1.Rain gauge
2.Battery compartment
3.RESET button
3
