Headquarters
For Belgium & Luxembourg
Thank you for buying the Pentax Digital Camera
About the Camera
For Safe USE of Your Camera
About the Battery Charger and the AC Adapter
Page
Care to be Taken During Handling
Regarding Product Registration
Contents
Playback/Deleting/Editing
Recording and Playback of Sound
Appendix
Settings
Printing Single Images 124 Printing All Images 126
Contents of the Operating Manual
Checking the Contents of the Package
Front
Names of Parts
Back
Four-way controller Menu button
Names of Operating Parts
Four-way controller
Guide Indications
Attaching the Strap
Open the battery/card cover
Powering the Camera
Installing the Battery
Removing the Battery
GettingStarted
Charging the Battery
GettingStarted
Recycling Batteries
Battery Level Indicator
Lit green
Charging the Battery Abroad
Denmark, Germany, Norway, Hungary, Finland
Getting
Using the AC Adapter optional
Started
Precautions When Using the Battery Charger or AC Adapter
Installing the SD Memory Card
Precautions When Using an SD Memory Card
Data Backup
Setting the switch to Lock protects the existing data by
Appropriate Sizes According to Use
Image Size and Quality of Still Pictures
Appropriate Quality According to Use
Appropriate Sizes Recorded Pixels According to Use
Default setting is 640 640×480
Size and Quality of Movies
Approximate Number of Recordable Images by Size and Quality
320 320×240
Default setting is C
Press the four-way controller
Setting the Display Language
Use the four-way controller To choose a language
Press the OK button Press the four-way controller
Setting the Date and Time
Use the four-way controller 23 to change the month
Spanish
English English
French
German Deutsch
Press the shutter release button fully
Press the shutter release button halfway
Instant Review
Using the Shutter Release Button
Press halfway
Press down fully
Playing Back the Previous or Next Image
Playing Back an Image
Press the Q Playback button after taking a picture
Start
Deleting the Displayed Image
Turning the Camera On and Off
Using the My Album Function
Press the power switch
Press the power switch again
CommonOperations
Press the power switch while pressing the OK button
Turning the Camera On in Playback Mode
Turning the Camera On in Voice Recording Mode
Press the power switch while pressing the QPlayback button
Capture Mode
Using the Button Functions
Playback Mode
Deletes the image displayed on the LCD monitor p.115
Shutter release button
Voice Recording Mode
To Save the Setting and Start Taking Pictures
Setting the Menus
How to Set the Menus
Use the four-way controller 23 to change the setting
Press the OK button or the four-way controller
To Save the Setting and Begin Playback of Images
To Save the Setting and Continue with Menu Operations
Press the Q Playback button
Menu button
Example of Menu Operation
Rec.Mode Menu
Menu List
Set-up Menu
Capture Mode Palette
Operating the Mode Palette
How to operate the Mode Palette
Mode Palette List
Text mode
Icon Landscape mode Flower mode Portrait mode
Sport mode
Pet mode
Playback Mode Palette
Taking Pictures
Changing the Mode
Selecting the Capture Mode
Displaying Shooting Information in Capture Mode
Backlight Off
Histogram Display
Guide Display
Taking No icons
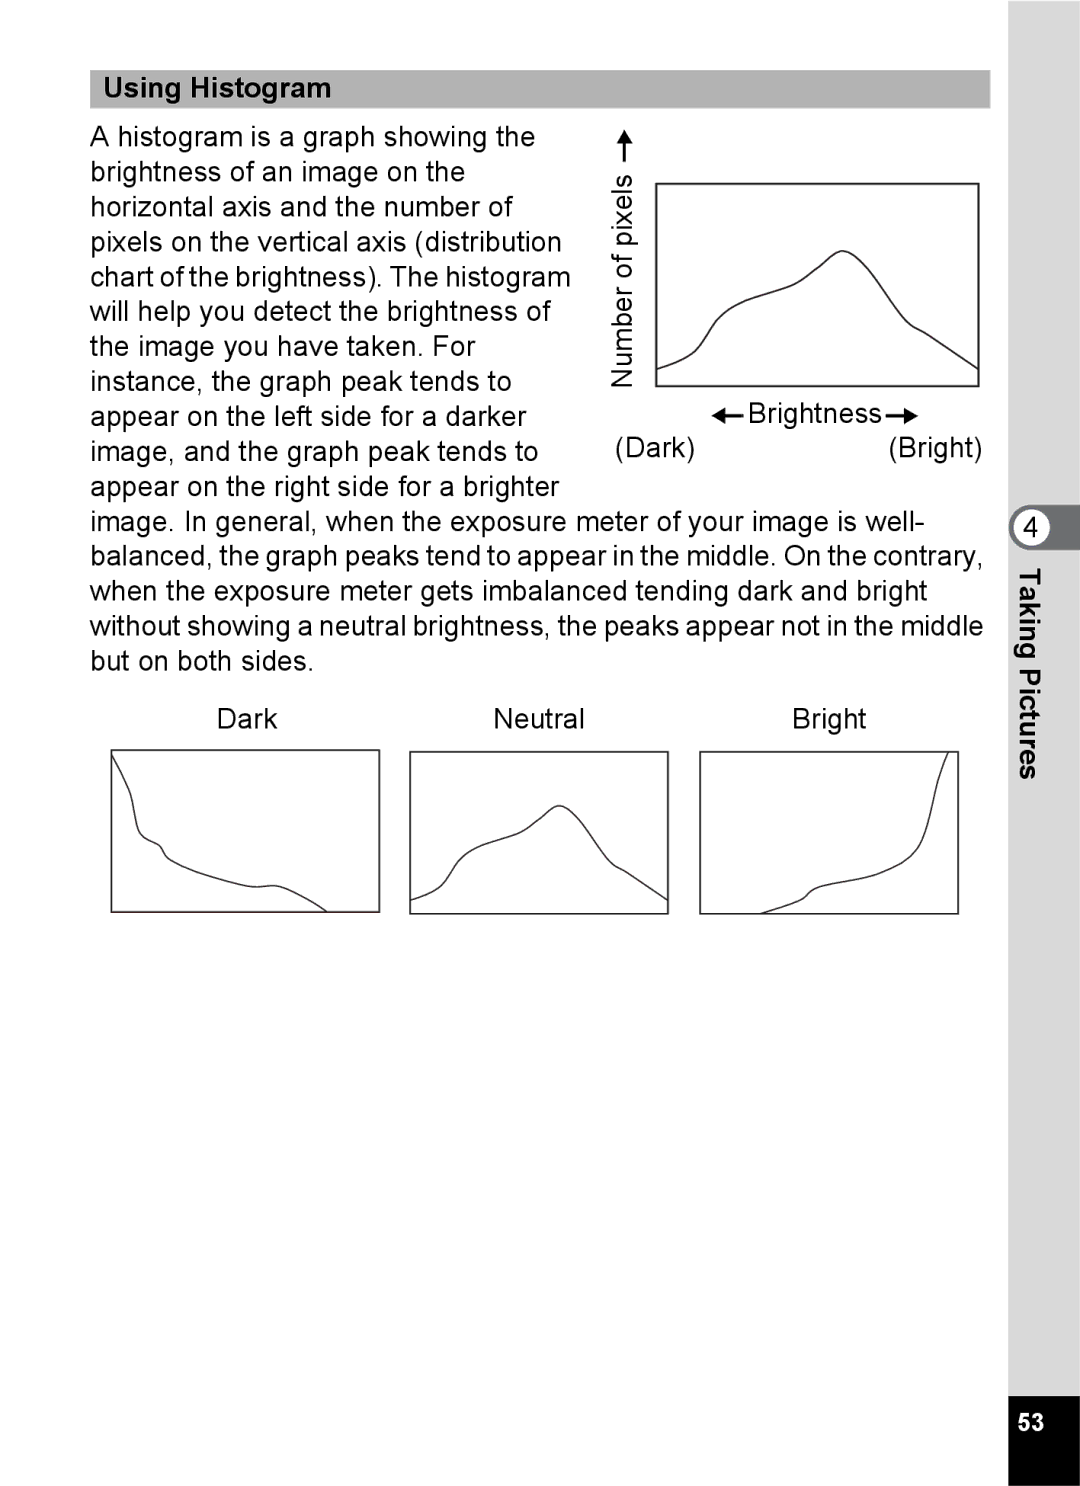
Using Histogram
Press the four-way controller 3 in Capture mode
Setting the Functions Program Mode
Use the four-way controller
Press the shutter release button fully
Capture mode
Use the four-way controller To choose the desired mode
Press the four-way controller 3
Use the four-way controller To select E, F, F, H, G or G
Taking Pictures of Your Pet Pet Mode
Press the four-way controller 45 to adjust the contrast
Taking Pictures of Text Text Mode
Use the four-way controller 23 to select
Taking Pictures of Dark Scenes Night Scene Mode
Flash Off icon
Taking Movies Movie Mode
To select C Movie Mode
This mode enables you to take movies and sounds
Keeping the Shutter Release Button Pressed
To select F Panorama Assist mode
Taking Panorama Pictures Panorama Assist Mode
Move the camera to the right and take the second image
Take the first image
Use the four-way controller 45 to choose a frame
Taking Pictures in Frame Composite mode
To Register a New Frame
Using the Self-timer
TakingPictures
Press the four-way controller 2 in Capture mode
Continuous Shooting Continuous Shooting Mode
TakingPictures
Press the shutter release button On the remote control unit
Using the Remote Control Unit optional
Taking Pictures Using the Remote Control
Changing the Magnification Using the Remote Control Unit
Press the zoom button on the remote control unit
Life of the Battery for the Remote Control Unit
Press the zoom button in Capture mode
Using the Zoom to Change the Subject Size
Setting the Digital Zoom
Press the Menu button in Capture mode
Selecting the Focus Mode
Setting the Shooting Functions
Focus mode
To select the focus mode
Press the four-way controller 5 in Capture mode
Manual Focus
OK MF
Flash Modes
Selecting the Flash Mode
Press the OK button
Number of Recorded Pixels Pictures
Selecting the Recorded Pixels of Still Pictures
Camera is ready to take the picture
Or creating websites
Selecting the Quality Level of Still Pictures
Taking Pictures Quality Levels
On a computer screen
Camera is ready to take the picture
Use the four-way controller 23 to select White Balance
Adjusting the White Balance
White Balance
Select K Manual on the White
Manual Setting
Balance screen
Focusing Area
Selecting the Autofocus Settings
Use the four-way controller 23 to select AF Setting
Changing the Focusing Area
Use the four-way controller 23 to select Focus Limiter
Setting the Focus Limiter
Setting the Auxiliary AF Light
AE Metering Modes
Setting the Light Metering Mode to Determine the Exposure
To select Sensitivity
Setting the Sensitivity
Sensitivity
To change the EV setting
Setting the Exposure EV Compensation
To select EV Compensation
Recorded Pixels
Selecting the Settings for Taking Movies
Use the four-way controller 23 to select Movie
Selecting the Recorded Pixels of Movies
Use the four-way controller 23 to select Quality Level
Use the four-way controller 23 to select Recorded Pixels
Selecting the Quality Level of Movies
Compensating for Camera Shake
Taking Time-lapse Movies
Setting the Instant Review Time
Registering a Function Initialize Rec. Mode · Movie
Setting the Green Button
To select Green Button
Press the OK button
Registering Frequently Used Functions Fn Setting
Functions that can be registered on Fn Setting
Initial settings for Fn Setting
Taking
To adjust sharpness
Setting the Image Sharpness
To select Sharpness
To adjust saturation
Setting the Color Saturation
To select Saturation
To adjust contrast
Setting the Image Contrast
To select Contrast
100
Saving the Settings
LCD monitor display mode is saved File #
Saving the Menu Items Memory
101
102
Returning the Shooting Functions to the Default Settings
Press the Green button in Capture mode
Use the four-way controller 23 to select Initialize
103
Playback of Sound
104
Plays back starting from the previous index
Playing Back Sound
Following operations can be performed during playback
105
106
Adding a Voice Memo
Recording a Voice Memo
To select Voice Memo Press the OK button
107
Playing Back a Voice Memo
108
Playing Back Images
Playing Back Still Pictures
Zoom Display
109
Setting the Quick Zoom Function
110
Playing Back Movies
Sensitivity Histogram
Displaying Shooting Information in Playback Mode
Folder name File name Protect icon Battery indicator
Recorded pixels Quality level White balance
112
Nine-Image Display
Use the four-way controller 3 to select Screen Effect
Slideshow
113
By one to the left
Use the four-way controller 45 to select the effect
114
Wipe
115
Deleting Images, Movies and Sounds
Deleting a Single Image, Movie or Sound
Use the four-way controller 2 to Select Delete
116
Press the Menu button in Playback mode
Setting the Quick Delete Function Playback/Deleting/Editing
Deleting a Voice Memo only
Deleting All Images
Enter the Playback mode and press the Green button twice
117
118
Enter the Playback mode and press w/f on the Zoom button
119
120
Protecting Images, Movies and Sounds from Deletion Protect
To select Z Protect Press the OK button
Protecting Images, Movies and Sounds
121
Protecting All Images, Movies and Sounds
Cable Playback/Deleting/Editing
Viewing Images on AV Equipment
Turn the AV equipment on
Turn the camera on
123
Playing Back an Image Using the Remote Control Unit optional
124
Setting the Printing Service Dpof
Printing Single Images
To select Dpof Press the OK button
125
Prints can be made according to the settings
Printing All Images
Enter the Playback mode and press the four-way controller
126
127
Direct Printing Using PictBridge
Connecting the Camera to the Printer
Select PictBridge for USB Connection on the B Set-up menu
Four-way controller
Select Paper Size and press
128
Press the OK button twice
Setting of the date imprint, and confirm the print setting
129
Disconnecting the Camera from the Printer
Printing Using the Dpof Settings
130
Resizing Single Images
Editing Images
Changing the Image Size and Quality
To select Resize Press the OK button
132
To change the quality
Trim the image
Trimming Images
133
134
Rotating the Displayed Image
Press the four-way controller 5 or the four-way controller
Press the Q button
Editing Pictures with Color Filters
136
Use the four-way controller 23 Menu Cancel
To select Overwrite or Save as Press the OK button
Selecting the Color Filter Eight Colors
137
Editing Pictures with the Digital Filter
To select Digital Filter Press the OK button
To select a desired filter Press the OK button
138
Selecting the Slim Filter
139
Editing Pictures with Brightness Filter
140
Saving a Frame from a Movie as a Still Picture
Editing Movies
Select a movie to edit Press the four-way controller
To select Movie Edit Press the OK button
142
Dividing a Movie
Extracting Movies
Select Extract on the Movie Edit screen Press the OK button
143
144
Red-eye Compensation
To select Z Press the OK button Red-eye Compensation
Or Save as
145
Press the the four-way controller 3 in Playback mode
Copying Files
To select Image/Sound Copy
146
To select the file to copy Press the OK button
To choose Start-up Screen Press the OK button
Camera Settings
Setting Up the Start-up Screen
Press the four-way controller 3 in Playback mode
Select Format
Formatting an SD Memory Card or the Built-in Memory
Select Format on the B Set-up menu
Use the four-way controller 2 to
Changing the Volume
Changing the Sound Settings
To change the operation volume
Select Playback Volume
150
To select Start-up Sound
To select 1, 2, 3, Off or
Changing the Sound
To choose a sound file
Setting the User Sound
Select User in on Press the OK button
Use the four-way controller 45 Menu
152
Changing the Date and Time
To choose the date and time
Display style
153
To change the month
Press the four-way controller 3 to select X Destination
Setting the World Time
To select X Destination or W
Hometown
155
156
Changing the Display Language
157
Changing the USB Connection Mode
Changing the Video Output Format
Use the four-way controller 23 to select Ntsc or PAL
158
Adjusting the Brightness of the LCD Monitor
159
Setting Power Saving
Setting the Guide Display
Setting Auto Power Off
160
161
Resetting to Default Settings
162
List of City
Rec. Mode Menu Items
Default Settings
Last Memory Setting
Reset Setting
164
165
Playback Mode Palette Items
166
Capture Mode and Functions
167
Capture Mode and Default Setting of Each Function
Text Food Frame Composite
168
169
Optional Accessories
170
Messages
171
172
Troubleshooting
173
Camera
Main Specifications
174
175
176
Power Supply
177
Warranty Policy
178
179
For customers in USA
For customers in Canada
Pour les utilisateurs au Canada
Declaration of Conformity
181
Information on disposal for users
Index
Battery/card cover
182
White Balance Wide World Time Write-protect switch
Power switch
183
Memo
Memo