VSX-9140TXH, VSX-9040TXH, VSX-23TXH, VSX-21TXH specifications
Pioneer has long been a frontrunner in the audio visual receiver market, and its VSX series is a testament to the brand's commitment to delivering high-quality home theater experiences. The VSX-21TXH, VSX-9040TXH, VSX-23TXH, and VSX-9140TXH are standout models that offer an impressive array of features, technologies, and characteristics.Starting with the VSX-21TXH, this receiver showcases Pioneer’s ability to produce powerful, immersive sound. It provides a robust 7.1-channel surround sound configuration, which allows for full-bodied audio staging, making it perfect for both movies and music. The device is equipped with Dolby TrueHD and DTS-HD Master Audio technologies, ensuring high-definition sound quality. One of its notable features is the Integrated HDMI circuitry, which allows support for multiple HD sources while maintaining an elegant and clean setup.
Moving on to the VSX-9040TXH, this model elevates the audio experience with its advanced Class D3 amplification technology. This innovative design delivers high efficiency while minimizing power consumption. The VSX-9040TXH supports both wired and wireless surround sound setups, featuring built-in Wi-Fi and Bluetooth connectivity. This model is particularly user-friendly, boasting an intuitive GUI that enables easy navigation and setup.
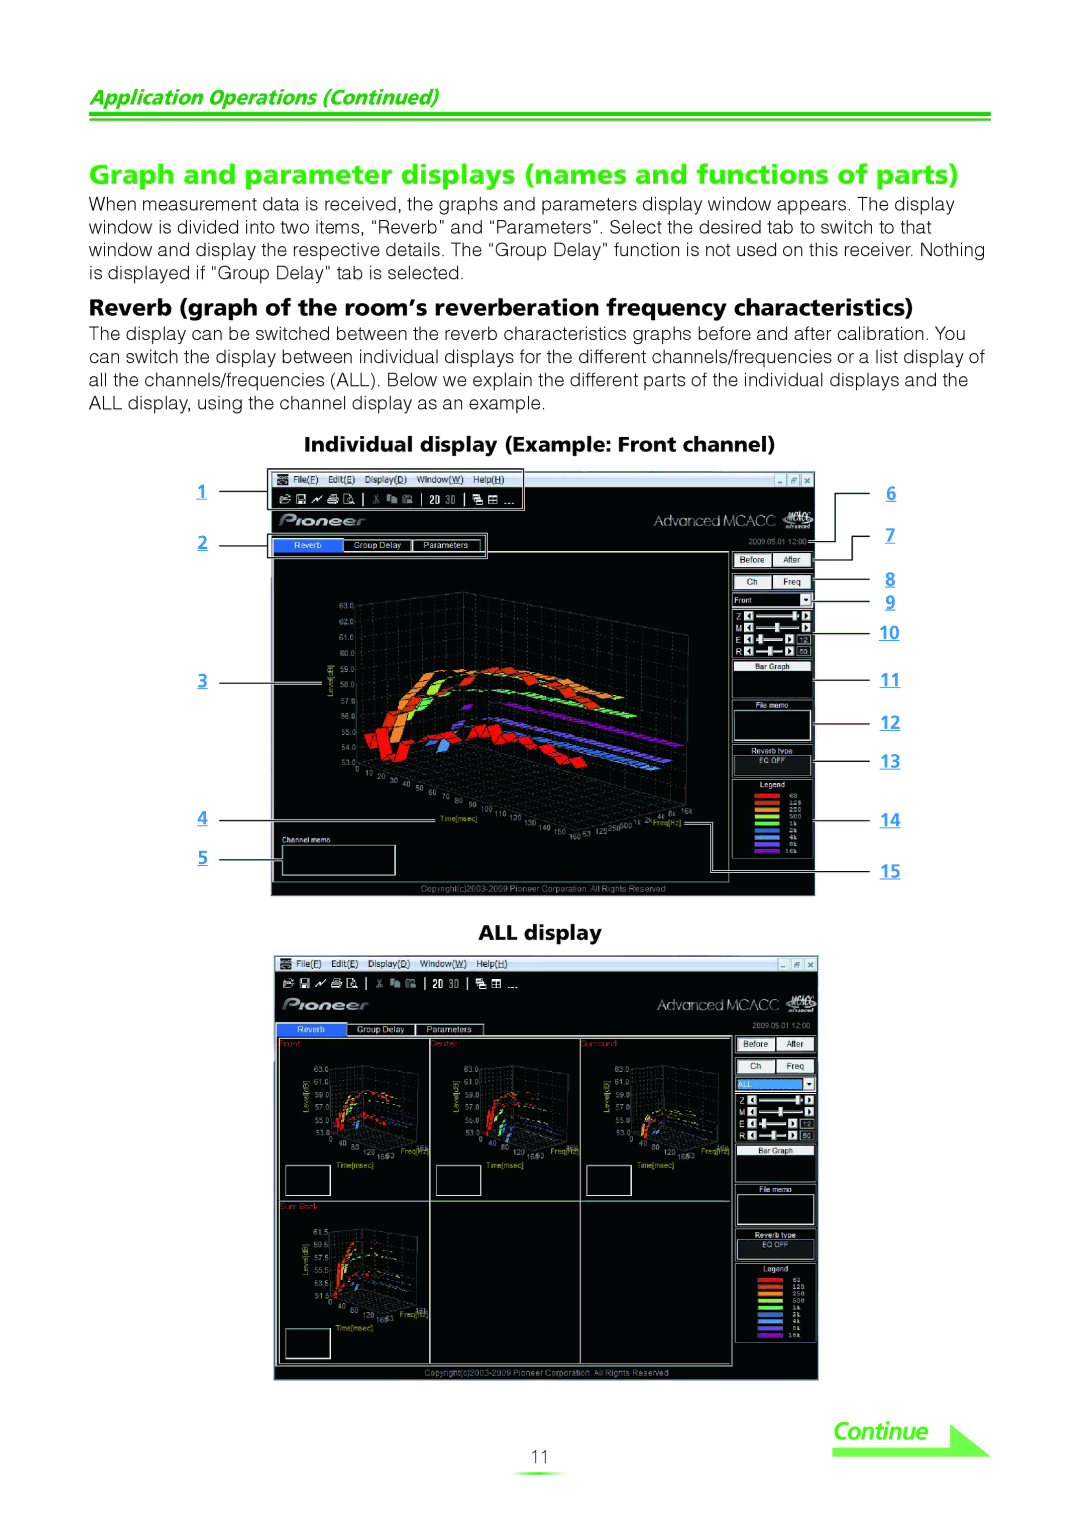
The VSX-23TXH adds further functionality with its inclusion of multi-zone audio capabilities, allowing users to enjoy different audio sources in separate rooms simultaneously. This model also features advanced sound optimization technology, such as MCACC (Multi-Channel Acoustic Calibration System), which automatically calibrates audio settings based on the room’s acoustics to deliver the best sound quality.
Lastly, the VSX-9140TXH represents the pinnacle of the VSX series with its 9.2 channel surround sound. This receiver is designed for true audiophiles, delivering exceptional sound clarity and richness in all audio formats. It offers support for the latest surround formats, including Dolby Atmos and DTS:X, which enable immersive three-dimensional sound experiences. Additionally, the receiver features a high-resolution audio playback feature, supporting formats such as FLAC and DSD for those who crave studio-quality sound.
In summary, the Pioneer VSX-21TXH, VSX-9040TXH, VSX-23TXH, and VSX-9140TXH are remarkable audio video receivers, each capitalizing on cutting-edge technology and innovative features. They cater to various audio needs, making them ideal choices for anyone looking to enhance their home cinema or music environments. These models not only promise superior sound and user experience but also stand as a reflection of Pioneer’s dedication to audio excellence.

