MEPS − Televisions | April 2005 |
Data on the overall ownership profile for televisions in New Zealand became limited when licensing ceased in 1999, and data collection is now only carried out by Statistics New Zealand and through surveys by firms such as A C Nielsen, all of whom charge for detailed information.
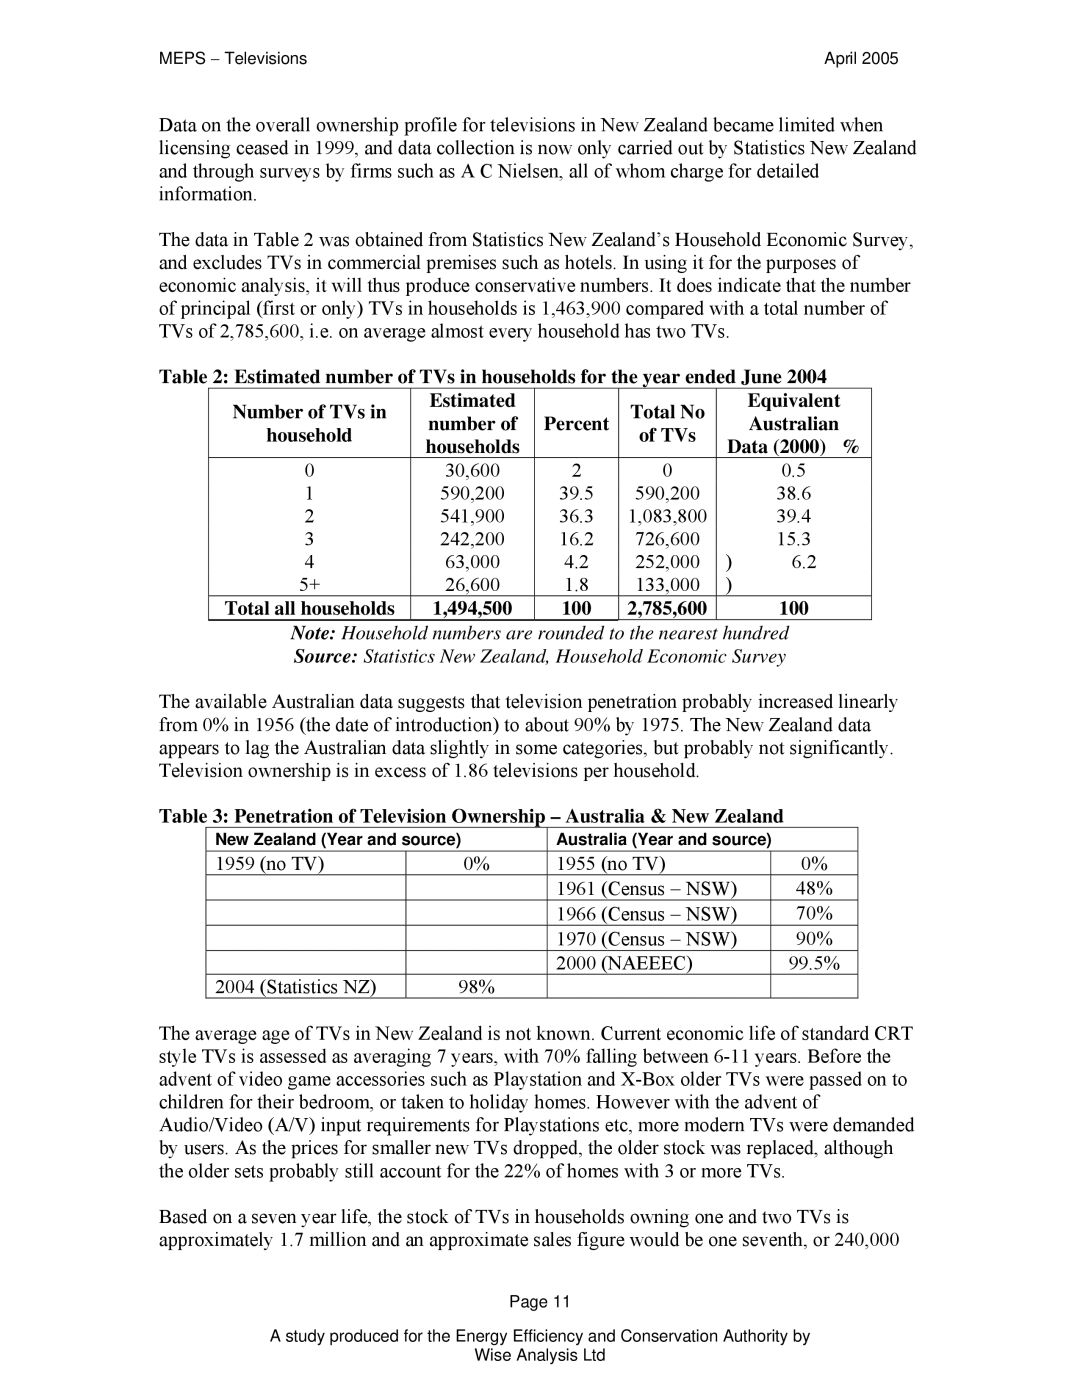
The data in Table 2 was obtained from Statistics New Zealand’s Household Economic Survey, and excludes TVs in commercial premises such as hotels. In using it for the purposes of economic analysis, it will thus produce conservative numbers. It does indicate that the number of principal (first or only) TVs in households is 1,463,900 compared with a total number of TVs of 2,785,600, i.e. on average almost every household has two TVs.
Table 2: Estimated number of TVs in households for the year ended June 2004
Number of TVs in | Estimated |
| Total No |
| Equivalent |
number of | Percent |
| Australian | ||
household | households |
| of TVs | Data (2000) % | |
|
|
| |||
0 | 30,600 | 2 | 0 |
| 0.5 |
1 | 590,200 | 39.5 | 590,200 |
| 38.6 |
2 | 541,900 | 36.3 | 1,083,800 |
| 39.4 |
3 | 242,200 | 16.2 | 726,600 |
| 15.3 |
4 | 63,000 | 4.2 | 252,000 | ) | 6.2 |
5+ | 26,600 | 1.8 | 133,000 | ) |
|
Total all households | 1,494,500 | 100 | 2,785,600 |
| 100 |
Note: Household numbers are rounded to the nearest hundred
Source: Statistics New Zealand, Household Economic Survey
The available Australian data suggests that television penetration probably increased linearly from 0% in 1956 (the date of introduction) to about 90% by 1975. The New Zealand data appears to lag the Australian data slightly in some categories, but probably not significantly. Television ownership is in excess of 1.86 televisions per household.
Table 3: Penetration of Television Ownership – Australia & New Zealand
New Zealand (Year and source) | Australia (Year and source) |
| ||||
1959 | (no TV) | 0% | 1955 (no TV) |
| 0% | |
|
|
| 1961 | (Census − NSW) |
| 48% |
|
|
| 1966 | (Census − NSW) |
| 70% |
|
|
| 1970 | (Census − NSW) |
| 90% |
|
|
| 2000 | (NAEEEC) |
| 99.5% |
2004 | (Statistics NZ) | 98% |
|
|
|
|
The average age of TVs in New Zealand is not known. Current economic life of standard CRT style TVs is assessed as averaging 7 years, with 70% falling between
Based on a seven year life, the stock of TVs in households owning one and two TVs is approximately 1.7 million and an approximate sales figure would be one seventh, or 240,000
Page 11
A study produced for the Energy Efficiency and Conservation Authority by
Wise Analysis Ltd
