MEPS − Televisions | April 2005 |
from the Australia New Zealand Trade Ministers' Meeting in 2003 stated that: “To this end, we are committed to ensuring that the Arrangement is supported by the continued development of joint Australian and New Zealand standards. We recognise the importance of joint standards to our business communities.”
There are no specific dispute resolution procedures. The close and
9.3Greenhouse Gas Reduction Potential
Avoided power costs are usually considered to save energy at marginal generation costs, which are thermal, and thus emit CO2. The methodology is demonstrated in some detail in Meridian’s Te Āpiti design document15 which shows a CO2 emission factor for thermal generation rising from of 572 g CO2/kWh in 2005, to 698 g CO2/kWh in 2025. The average over this 20 year period is 635 g CO2/kWh.
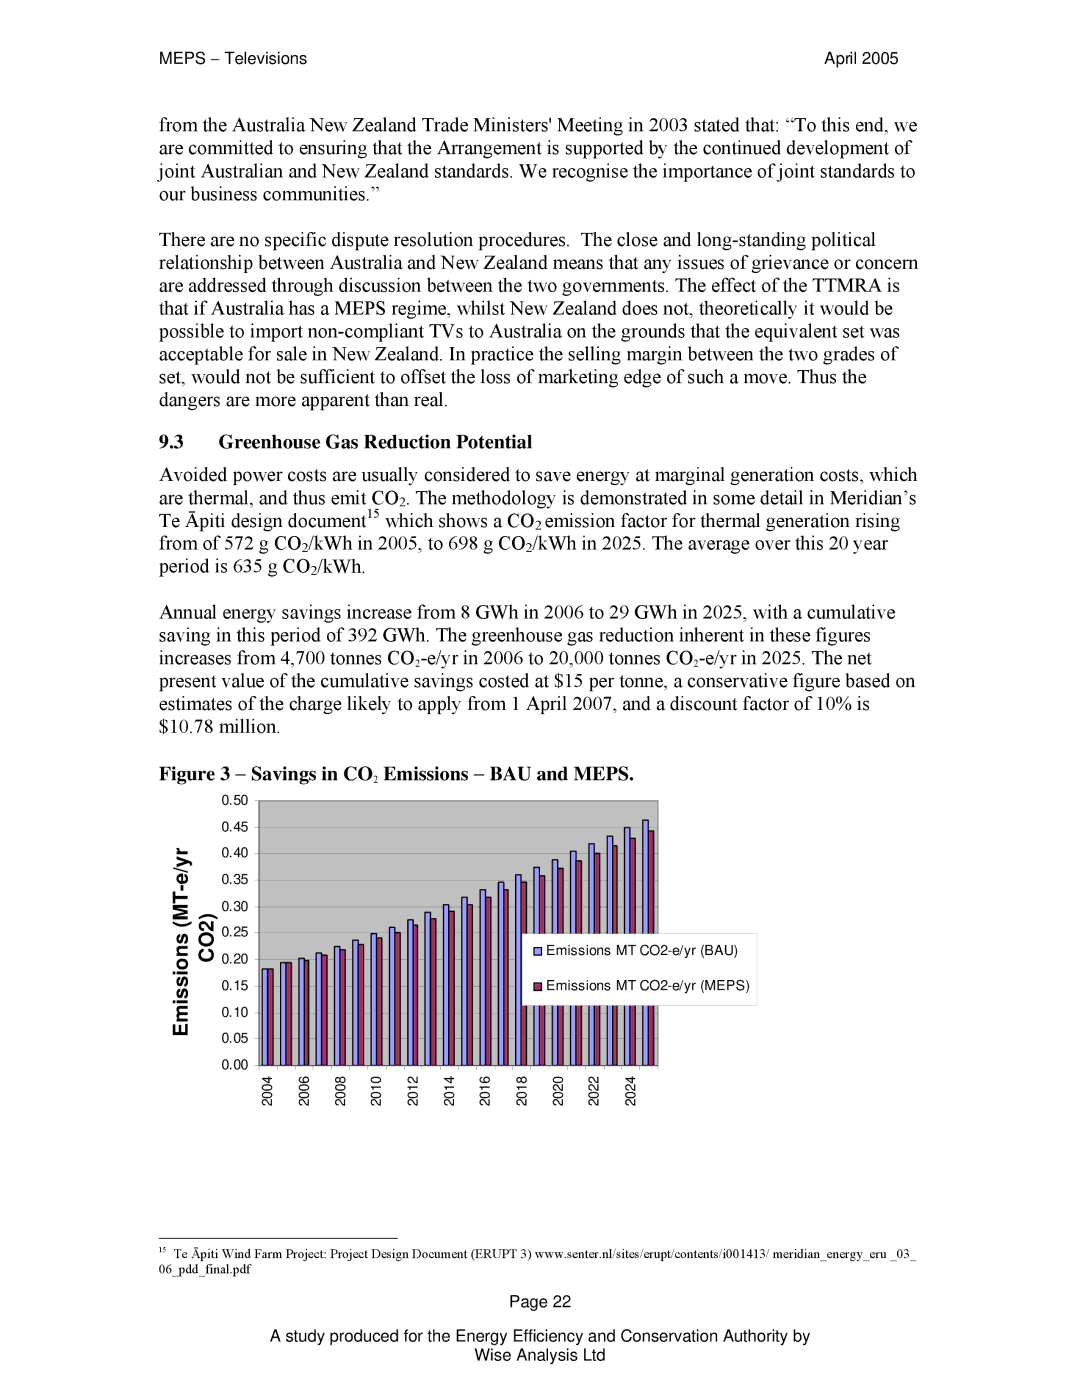
Annual energy savings increase from 8 GWh in 2006 to 29 GWh in 2025, with a cumulative saving in this period of 392 GWh. The greenhouse gas reduction inherent in these figures increases from 4,700 tonnes
Figure 3 − Savings in CO2 Emissions − BAU and MEPS.
|
| 0.50 |
|
|
|
|
|
|
|
|
|
|
|
| 0.45 |
|
|
|
|
|
|
|
|
|
|
| 0.40 |
|
|
|
|
|
|
|
|
|
| |
| 0.35 |
|
|
|
|
|
|
|
|
|
| |
Emissions (MT | CO2) | 0.30 |
|
|
|
|
|
|
|
|
|
|
0.25 |
|
|
|
|
|
|
| Emissions MT | ||||
0.20 |
|
|
|
|
|
|
| |||||
|
|
|
|
|
|
|
|
|
| |||
0.15 |
|
|
|
|
|
|
| Emissions MT | ||||
0.10 |
|
|
|
|
|
|
|
|
|
| ||
0.05 |
|
|
|
|
|
|
|
|
|
| ||
|
|
|
|
|
|
|
|
|
|
|
| |
|
| 0.00 |
|
|
|
|
|
|
|
|
|
|
|
| 2004 | 2006 | 2008 | 2010 | 2012 | 2014 | 2016 | 2018 | 2020 | 2022 | 2024 |
15Te Āpiti Wind Farm Project: Project Design Document (ERUPT 3) www.senter.nl/sites/erupt/contents/i001413/ meridian_energy_eru _03_
06_pdd_final.pdf
Page 22
A study produced for the Energy Efficiency and Conservation Authority by
Wise Analysis Ltd
