5.3 Compander Law Display
This shows the output level for any given input level according to the Compander controls which are currently being used. You can see both the compressor and expander threshold, indicated by the two knees. As the ratio of the compressor is increased, you can see the top portion flatten out indicating that the output level for any given input is being reduced.
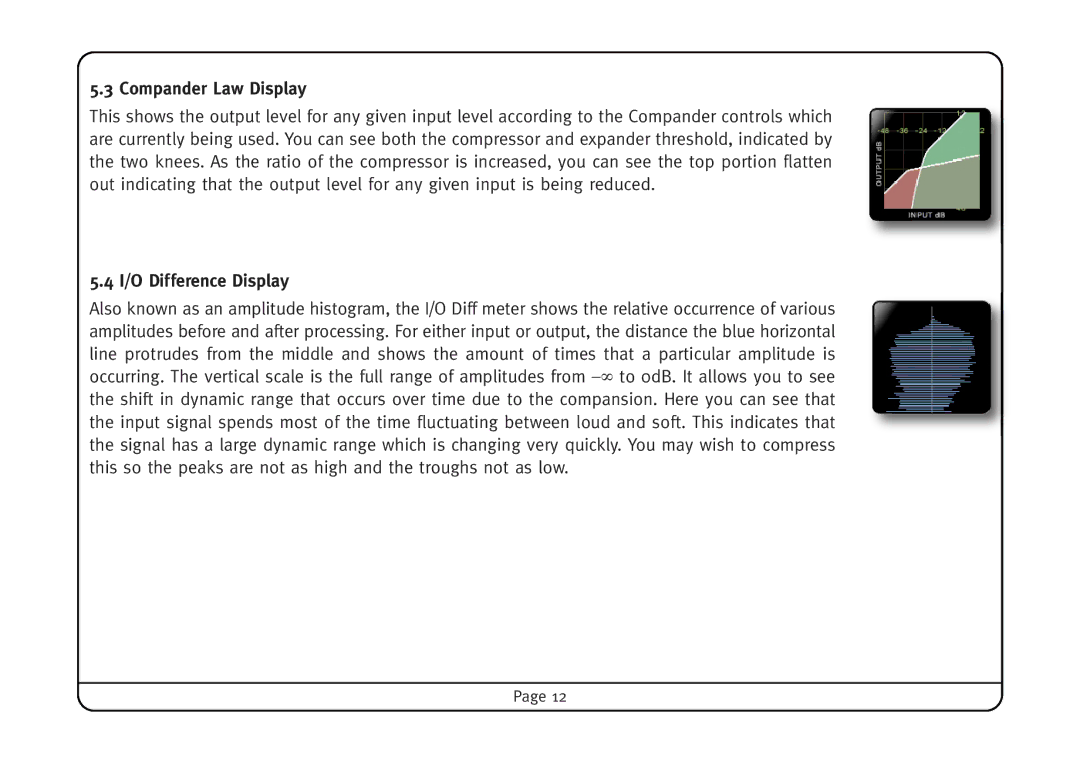
5.4 I/O Difference Display
Also known as an amplitude histogram, the I/O Diff meter shows the relative occurrence of various amplitudes before and after processing. For either input or output, the distance the blue horizontal line protrudes from the middle and shows the amount of times that a particular amplitude is occurring. The vertical scale is the full range of amplitudes from
Page 12