ELECTRICAL CHARACTERISTICS CURVES
| 97 |
|
|
|
|
|
|
|
| 96 |
|
|
|
|
|
|
|
| 95 |
|
|
|
|
|
|
|
(%) | 94 |
|
|
|
|
|
|
|
Efficiency |
|
|
|
|
|
|
| |
93 |
|
|
|
|
|
|
| |
|
|
|
|
|
|
|
| |
| 92 |
|
|
|
| 38Vin |
|
|
|
|
|
|
|
| 48Vin |
|
|
| 91 |
|
|
|
| 55Vin |
|
|
|
|
|
|
|
|
|
| |
| 90 |
|
|
|
|
|
|
|
| 3 | 6 | 9 | 12 | 15 | 18 | 21 | 24 |
Output Current (A)
10 |
|
|
|
|
|
|
|
|
8 |
|
|
|
|
|
|
|
|
6 |
|
|
|
|
|
|
|
|
Loss(W) |
|
|
|
|
|
|
|
|
4 |
|
|
|
|
|
|
|
|
|
|
|
|
|
| 3 8 V i n |
|
|
2 |
|
|
|
|
| 4 8 V i n |
|
|
|
|
|
|
|
| 5 5 V i n |
|
|
0 |
|
|
|
|
|
|
|
|
0 | 3 | 6 | 9 | 12 | 15 | 18 | 21 | 24 |
Output Current (A)
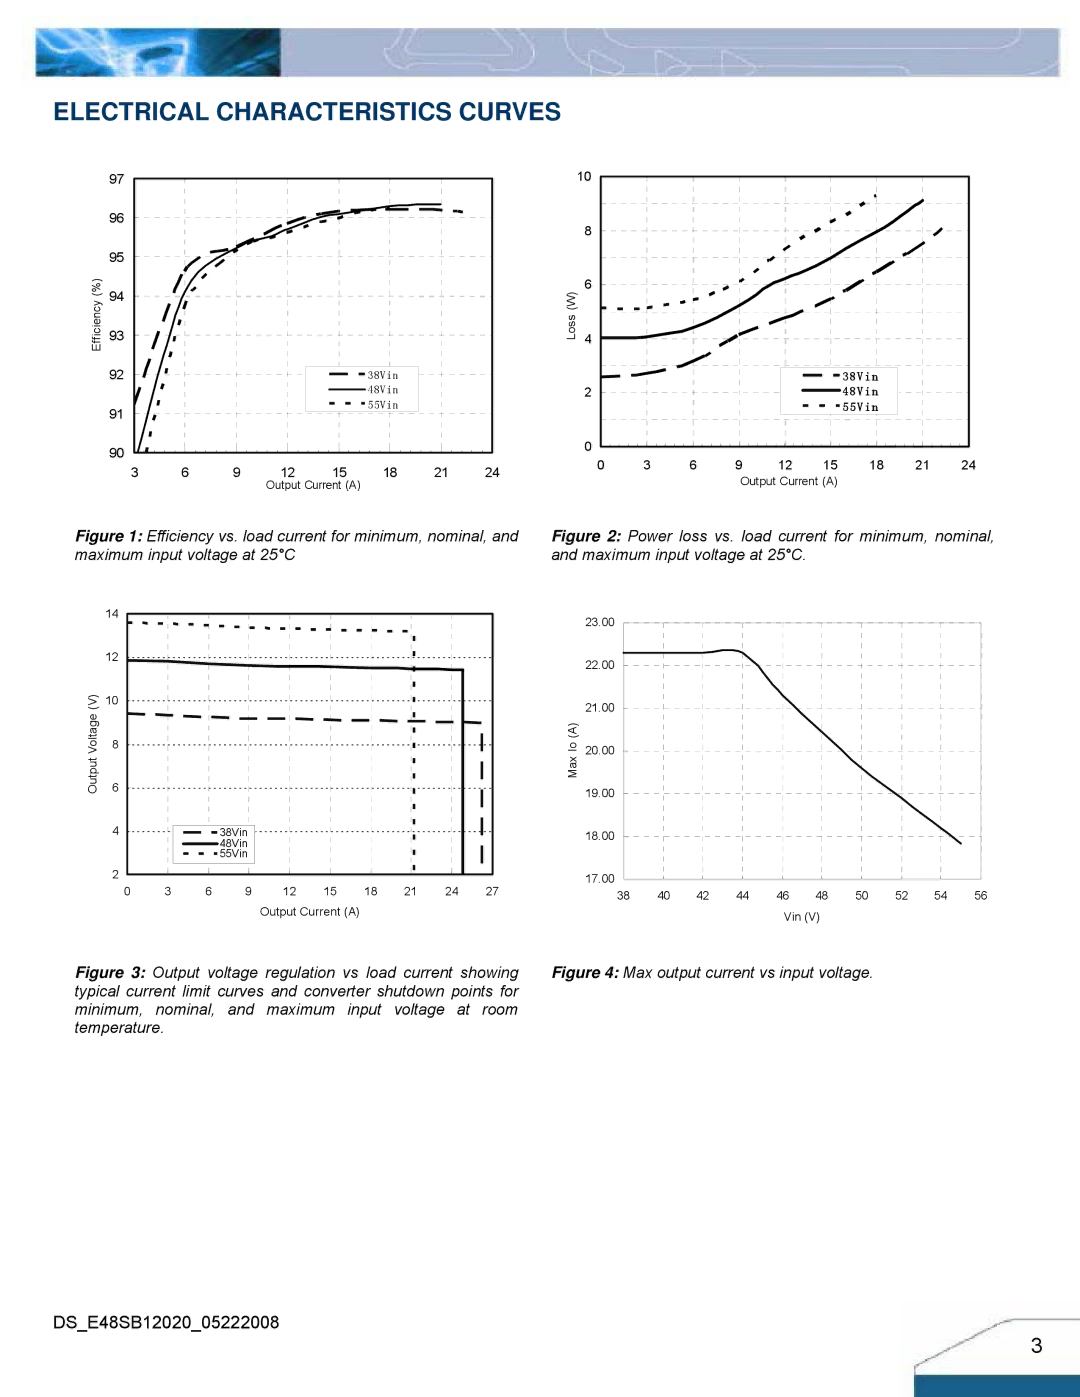
Figure 1: Efficiency vs. load current for minimum, nominal, and maximum input voltage at 25°C
Figure 2: Power loss vs. load current for minimum, nominal, and maximum input voltage at 25°C.
| 14 |
|
|
|
|
|
|
|
|
|
| 12 |
|
|
|
|
|
|
|
|
|
(V) | 10 |
|
|
|
|
|
|
|
|
|
Output Voltage | 8 |
|
|
|
|
|
|
|
|
|
6 |
|
|
|
|
|
|
|
|
| |
| 4 |
|
| 38Vin |
|
|
|
|
|
|
|
|
|
| 48Vin |
|
|
|
|
|
|
|
|
|
| 55Vin |
|
|
|
|
|
|
| 2 |
|
|
|
|
|
|
|
|
|
| 0 | 3 | 6 | 9 | 12 | 15 | 18 | 21 | 24 | 27 |
Output Current (A)
23.00 |
|
|
|
|
|
|
|
|
|
22.00 |
|
|
|
|
|
|
|
|
|
21.00 |
|
|
|
|
|
|
|
|
|
Io(A) |
|
|
|
|
|
|
|
|
|
20.00 |
|
|
|
|
|
|
|
|
|
Max |
|
|
|
|
|
|
|
|
|
19.00 |
|
|
|
|
|
|
|
|
|
18.00 |
|
|
|
|
|
|
|
|
|
17.00 |
|
|
|
|
|
|
|
|
|
38 | 40 | 42 | 44 | 46 | 48 | 50 | 52 | 54 | 56 |
Vin (V)
Figure 3: Output voltage regulation vs load current showing | Figure 4: Max output current vs input voltage. |
typical current limit curves and converter shutdown points for |
|
minimum, nominal, and maximum input voltage at room |
|
temperature. |
|
DS_E48SB12020_05222008
3
