Manuals
/
Delta Electronics
/
Computer Equipment
/
Power Supply
Delta Electronics
Series E24SR
manual
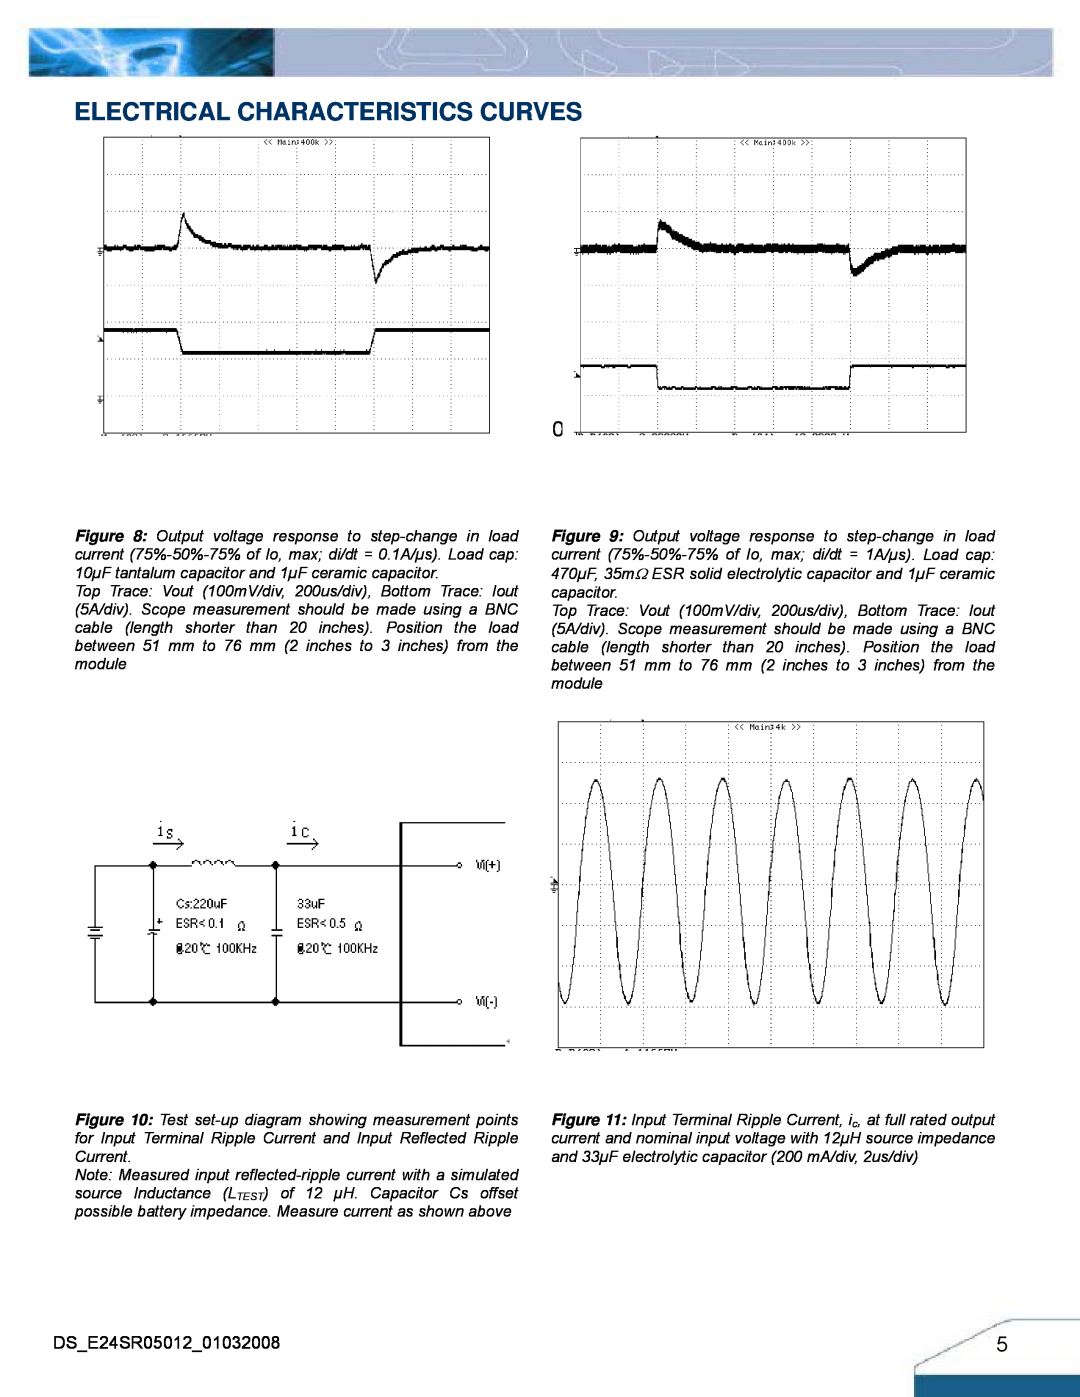
Electrical Characteristics Curves
Models:
Series E24SR
1
5
15
15
Download
15 pages
25.72 Kb
1
2
3
4
5
6
7
8
Specifications
DATASHEET DSE24SR0501201032008
Warranty
Output Voltage Adjustment TRIM
Thermal Testing Setup
Safety
Features Descriptions
Page 5
Image 5
Page 4
Page 6
Page 5
Image 5
Page 4
Page 6
Contents
DATASHEET DSE24SR0501201032008
FEATURES
OPTIONS
APPLICATIONS
INPUT CHARACTERISTICS
TECHNICAL SPECIFICATIONS
OUTPUT CHARACTERISTICS
DYNAMIC CHARACTERISTICS
ELECTRICAL CHARACTERISTICS CURVES
For Positive Remote On/Off Logic
For Negative Remote On/Off Logic
Note Measured input reflected-ripple current with a simulated source Inductance LTEST of 12 μH. Capacitor Cs offset possible battery impedance. Measure current as shown above
Figure 12 Input reflected ripple current, is, through a 12µH
Soldering and Cleaning Considerations
Safety Considerations
DESIGN CONSIDERATIONS
Input Source Impedance
Over-Current Protection
FEATURES DESCRIPTIONS
Over-Voltage Protection
Remote Sense
Output Voltage Adjustment TRIM
FEATURES DESCRIPTIONS CON
Ex. When Trim-down -10% 5V×0.9=0.45V
Rtrim − down = ⎢
THERMAL CONSIDERATIONS
Thermal Testing Setup
THERMAL CURVES
Thermal Derating
SURFACE-MOUNT TAPE & REEL
PICK AND PLACE LOCATION
RECOMMENDED PAD LAYOUT SMD
LEAD FREE SAC PROCESS RECOMMEND TEMP. PROFILE
LEADED Sn/Pb PROCESS RECOMMEND TEMP. PROFILE
Temp
Time
Surface-mount module
MECHANICAL DRAWING
Through-hole module
Pin No
MODEL LIST
PART NUMBERING SYSTEM
WARRANTY
MODEL NAME
at any time, without notice
Top
Page
Image
Contents