Performance Charts
Performance Charts
Low Pressure Setting
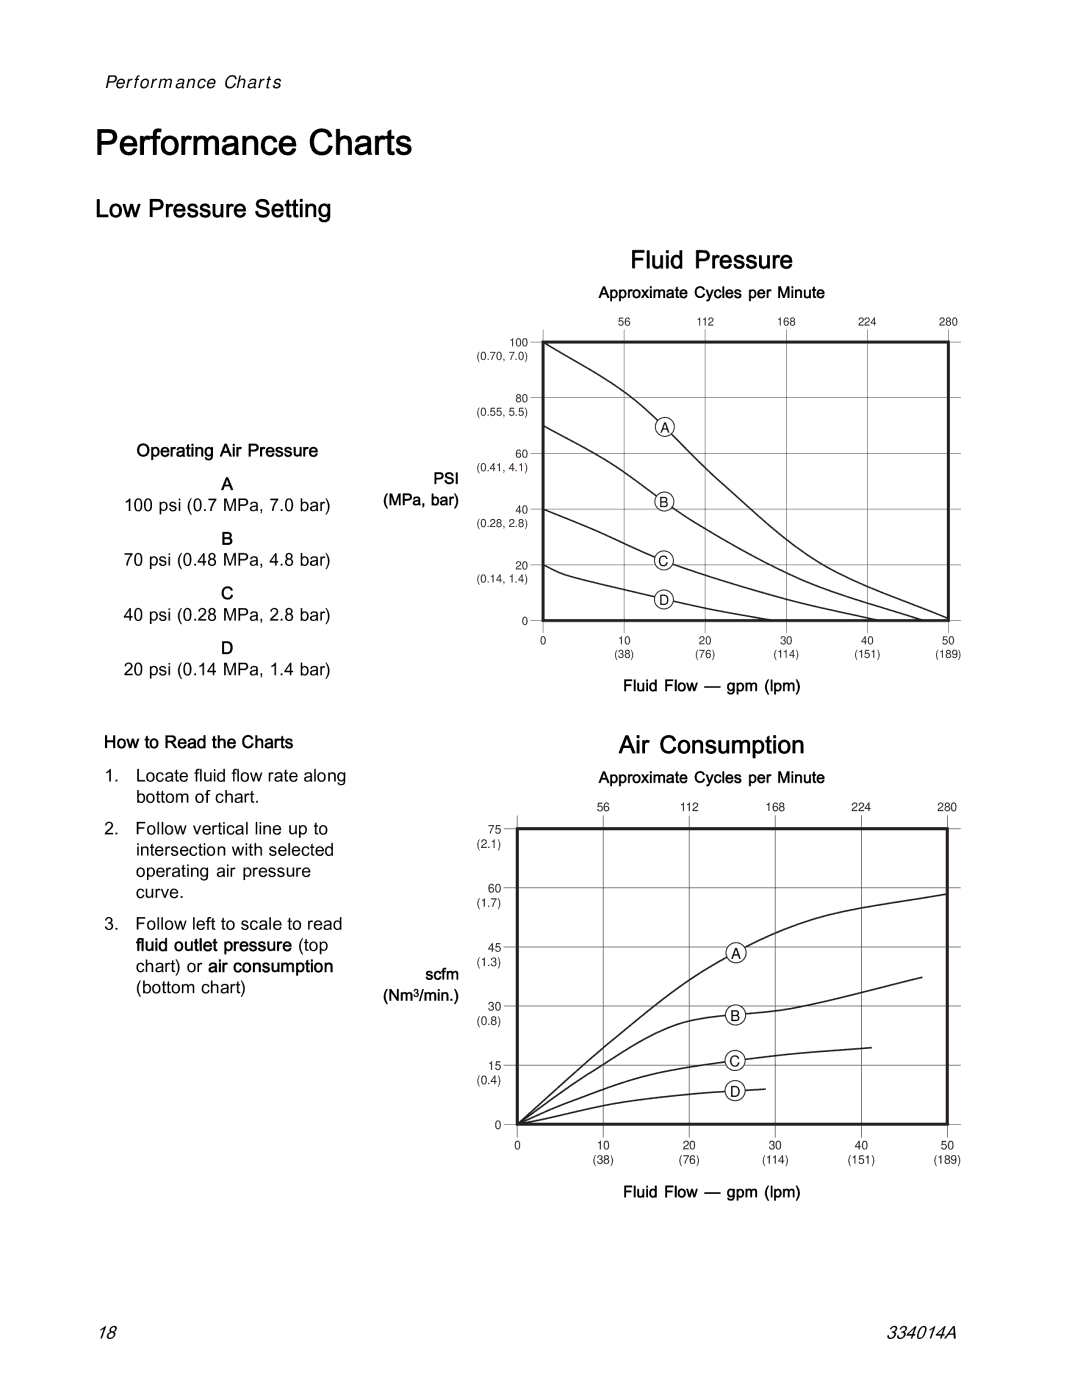
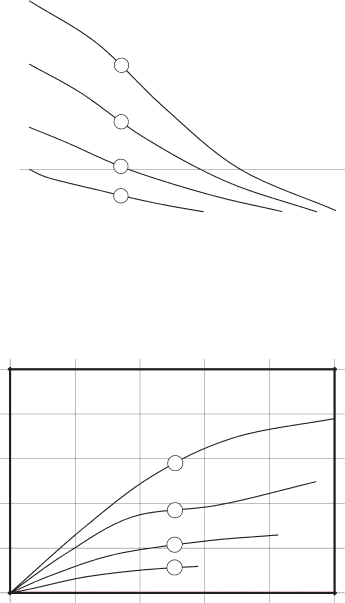
Fluid Pressure
Approximate Cycles per Minute
Operating Air Pressure
A
100 psi (0.7 MPa, 7.0 bar)
B
70 psi (0.48 MPa, 4.8 bar)
C
40 psi (0.28 MPa, 2.8 bar)
D
20 psi (0.14 MPa, 1.4 bar)
How to Read the Charts
1.Locate fluid flow rate along bottom of chart.
2.Follow vertical line up to intersection with selected operating air pressure curve.
3.Follow left to scale to read fluid outlet pressure (top chart) or air consumption (bottom chart)
PSI (MPa, bar)
scfm (Nm3/min.)
|
| 56 | 112 | 168 | 224 | 280 | |||||
100 |
|
|
|
|
|
|
|
|
|
|
|
|
|
|
|
|
|
|
|
|
|
| |
(0.70, 7.0) |
|
|
|
|
|
|
|
|
|
|
|
80 |
|
|
|
|
|
|
|
|
|
|
|
|
|
|
|
|
|
|
|
|
|
| |
(0.55, 5.5) |
|
|
| A |
|
|
|
|
|
|
|
|
|
|
|
|
|
|
|
|
|
| |
60 |
|
|
|
|
|
|
|
|
|
|
|
|
|
|
|
|
|
|
|
|
|
| |
(0.41, 4.1) |
|
|
|
|
|
|
|
|
|
|
|
40 |
|
|
| B |
|
|
|
|
|
|
|
|
|
|
|
|
|
|
|
|
|
| |
(0.28, 2.8) |
|
|
|
|
|
|
|
|
|
|
|
20 |
|
|
| C |
|
|
|
|
|
|
|
|
|
|
|
|
|
|
|
|
|
| |
(0.14, 1.4) |
|
|
|
|
|
|
|
|
|
|
|
|
|
|
| D |
|
|
|
|
|
|
|
0 |
|
|
|
|
|
|
|
|
|
|
|
|
|
|
|
|
|
|
|
|
|
| |
0 | 10 | 20 | 30 | 40 | 50 | ||||||
|
| (38) | (76) | (114) | (151) | (189) | |||||
Fluid Flow — gpm (lpm)
Air Consumption
Approximate Cycles per Minute
56 | 112 | 168 | 224 | 280 |
75
(2.1)
60
(1.7)
45 |
|
| A |
|
|
(1.3) |
|
|
|
| |
|
|
|
|
| |
30 |
|
| B |
|
|
(0.8) |
|
|
|
| |
15 |
|
| C |
|
|
(0.4) |
|
| D |
|
|
|
|
|
|
| |
0 |
|
|
|
|
|
0 | 10 | 20 | 30 | 40 | 50 |
| (38) | (76) | (114) | (151) | (189) |
Fluid Flow — gpm (lpm)
18 | 334014A |