Bottom Presentation
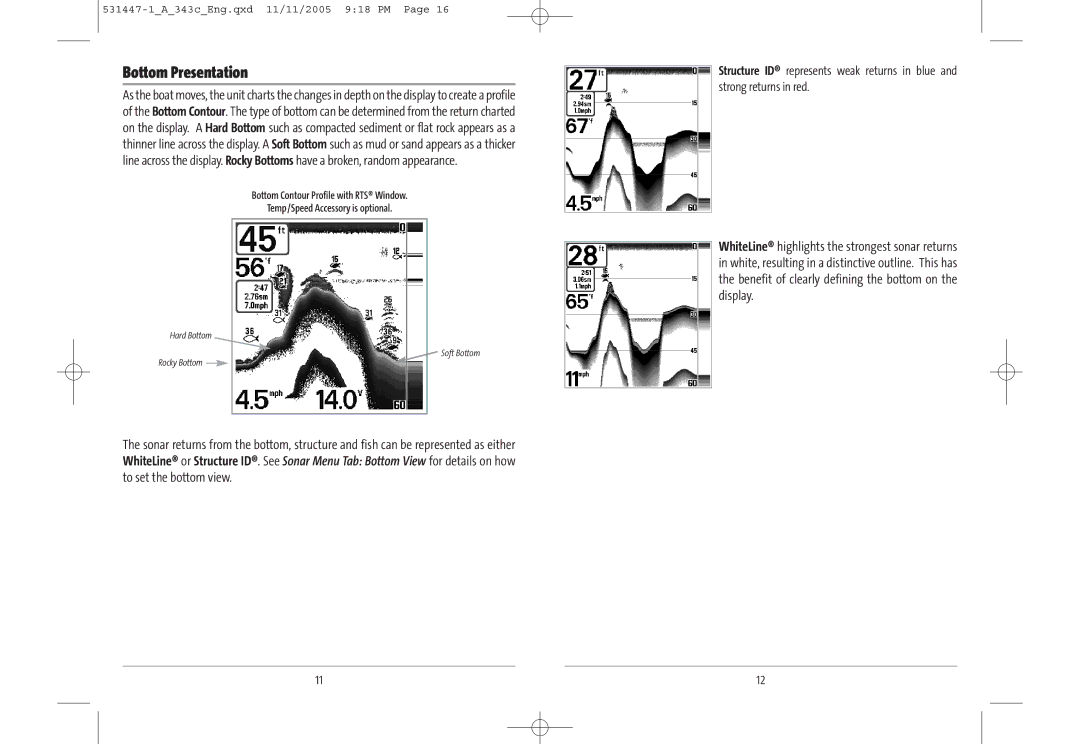
As the boat moves, the unit charts the changes in depth on the display to create a profile of the Bottom Contour. The type of bottom can be determined from the return charted on the display. A Hard Bottom such as compacted sediment or flat rock appears as a thinner line across the display. A Soft Bottom such as mud or sand appears as a thicker line across the display. Rocky Bottoms have a broken, random appearance.
Bottom Contour Profile with RTS® Window.
Temp/Speed Accessory is optional.
Hard Bottom
Soft Bottom
Rocky Bottom ![]()
The sonar returns from the bottom, structure and fish can be represented as either WhiteLine® or Structure ID®. See Sonar Menu Tab: Bottom View for details on how to set the bottom view.
Structure ID® represents weak returns in blue and strong returns in red.
WhiteLine® highlights the strongest sonar returns in white, resulting in a distinctive outline. This has the benefit of clearly defining the bottom on the display.
11 | 12 |