|
| No | With |
| |
| Lookaside | Lookaside | Win | ||
100 Mb/s | 14 | (0.5) | 13 (2.2) | 7.1% | |
10 Mb/s | 39 | (0.4) | 12 (0.5) | 69.2% | |
1 Mb/s | 317 | (0.3) | 12 (0.3) | 96.2% | |
100 Kb/s | 4301 | (0.6) | 12 (0.1) | 99.7% | |
|
|
|
|
| |
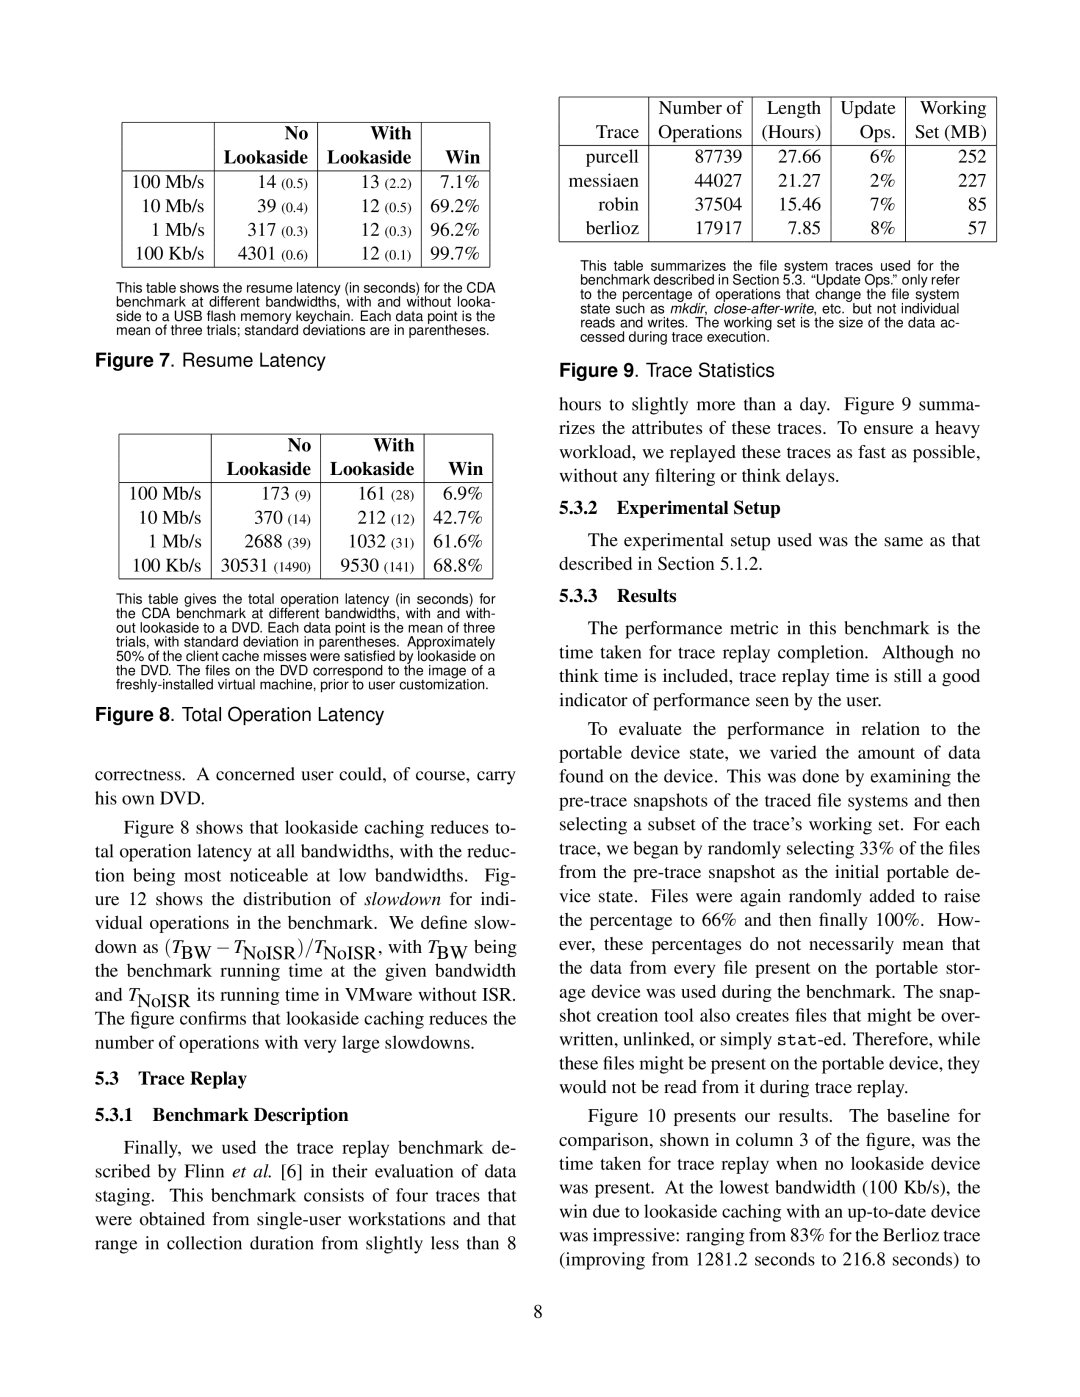
This table shows the resume latency (in seconds) for the CDA benchmark at different bandwidths, with and without looka- side to a USB flash memory keychain. Each data point is the mean of three trials; standard deviations are in parentheses.
Figure 7. Resume Latency
|
| No | With |
| |
| Lookaside | Lookaside | Win | ||
100 Mb/s | 173 (9) | 161 | (28) | 6.9% | |
10 Mb/s | 370 | (14) | 212 | (12) | 42.7% |
1 Mb/s | 2688 | (39) | 1032 | (31) | 61.6% |
100 Kb/s | 30531 (1490) | 9530 (141) | 68.8% | ||
This table gives the total operation latency (in seconds) for the CDA benchmark at different bandwidths, with and with- out lookaside to a DVD. Each data point is the mean of three trials, with standard deviation in parentheses. Approximately 50% of the client cache misses were satisfied by lookaside on the DVD. The files on the DVD correspond to the image of a
Figure 8. Total Operation Latency
correctness. A concerned user could, of course, carry his own DVD.
Figure 8 shows that lookaside caching reduces to- tal operation latency at all bandwidths, with the reduc- tion being most noticeable at low bandwidths. Fig- ure 12 shows the distribution of slowdown for indi- vidual operations in the benchmark. We define slow-
down as (TBW − TNoISR)/TNoISR, with TBW being the benchmark running time at the given bandwidth
and TNoISR its running time in VMware without ISR. The figure confirms that lookaside caching reduces the
number of operations with very large slowdowns.
5.3 Trace Replay
5.3.1 Benchmark Description
Finally, we used the trace replay benchmark de- scribed by Flinn et al. [6] in their evaluation of data staging. This benchmark consists of four traces that were obtained from
| Number of | Length | Update | Working |
Trace | Operations | (Hours) | Ops. | Set (MB) |
|
|
|
|
|
purcell | 87739 | 27.66 | 6% | 252 |
messiaen | 44027 | 21.27 | 2% | 227 |
robin | 37504 | 15.46 | 7% | 85 |
berlioz | 17917 | 7.85 | 8% | 57 |
|
|
|
|
|
This table summarizes the file system traces used for the benchmark described in Section 5.3. “Update Ops.” only refer to the percentage of operations that change the file system state such as mkdir,
Figure 9. Trace Statistics
hours to slightly more than a day. Figure 9 summa- rizes the attributes of these traces. To ensure a heavy workload, we replayed these traces as fast as possible, without any filtering or think delays.
5.3.2Experimental Setup
The experimental setup used was the same as that described in Section 5.1.2.
5.3.3Results
The performance metric in this benchmark is the time taken for trace replay completion. Although no think time is included, trace replay time is still a good indicator of performance seen by the user.
To evaluate the performance in relation to the portable device state, we varied the amount of data found on the device. This was done by examining the
Figure 10 presents our results. The baseline for comparison, shown in column 3 of the figure, was the time taken for trace replay when no lookaside device was present. At the lowest bandwidth (100 Kb/s), the win due to lookaside caching with an up-to-date device was impressive: ranging from 83% for the Berlioz trace (improving from 1281.2 seconds to 216.8 seconds) to
8
