|
|
|
|
| Lookaside Device State |
|
| ||||
Trace | Bandwidth | No Device | 100% | 66% | 33% | ||||||
| 100 | Mb/s | 50.1 | (2.6) | 53.1 | (2.4) | 50.5 | (3.1) | 48.8 | (1.9) | |
Purcell | 10 Mb/s | 61.2 | (2.0) | 55.0 | (6.5) | 56.5 | (2.9) | 56.6 | (4.6) | ||
| 1 | Mb/s | 292.8 | (4.1) | 178.4 | (3.1) | 223.5 | (1.8) | 254.2 | (2.0) | |
| 100 Kb/s | 2828.7 (28.0) | 1343.0 | (0.7) | 2072.1 (30.8) | 2404.6 (16.3) | |||||
| 100 | Mb/s | 26.4 | (1.6) | 31.8 | (0.9) | 29.8 | (0.9) | 27.9 | (0.8) | |
Messiaen | 10 Mb/s | 36.3 | (0.5) | 34.1 | (0.7) | 36.7 | (1.5) | 37.8 | (0.5) | ||
| 1 | Mb/s | 218.9 | (1.2) | 117.8 | (0.9) | 157.0 | (0.6) | 184.8 | (1.3) | |
| 100 Kb/s | 2327.3 (14.8) | 903.8 | (1.4) | 1439.8 | (6.3) | 1856.6 (89.2) | ||||
| 100 | Mb/s | 30.0 | (1.6) | 34.3 | (3.1) | 33.1 | (1.2) | 30.6 | (2.1) | |
Robin | 10 Mb/s | 37.3 | (2.6) | 33.3 | (3.8) | 33.8 | (2.5) | 37.7 | (4.5) | ||
| 1 | Mb/s | 229.1 | (3.4) | 104.1 | (1.3) | 143.2 | (3.3) | 186.7 | (2.5) | |
| 100 Kb/s | 2713.3 | (1.5) | 750.4 | (5.4) | 1347.6 (29.6) | 2033.4 (124.6) | ||||
|
|
|
|
|
|
|
|
|
|
| |
| 100 | Mb/s | 8.2 | (0.3) | 8.9 | (0.2) | 9.0 | (0.3) | 8.8 | (0.2) | |
Berlioz | 10 Mb/s | 12.9 | (0.8) | 9.3 | (0.3) | 9.9 | (0.4) | 12.0 | (1.6) | ||
| 1 | Mb/s | 94.0 | (0.3) | 30.2 | (0.6) | 50.8 | (0.3) | 71.6 | (0.5) | |
| 100 Kb/s | 1281.2 (54.6) | 216.8 | (0.5) | 524.4 | (0.4) | 1090.5 (52.6) | ||||
| |||||||||||
|
|
|
|
|
|
|
|
|
|
| |
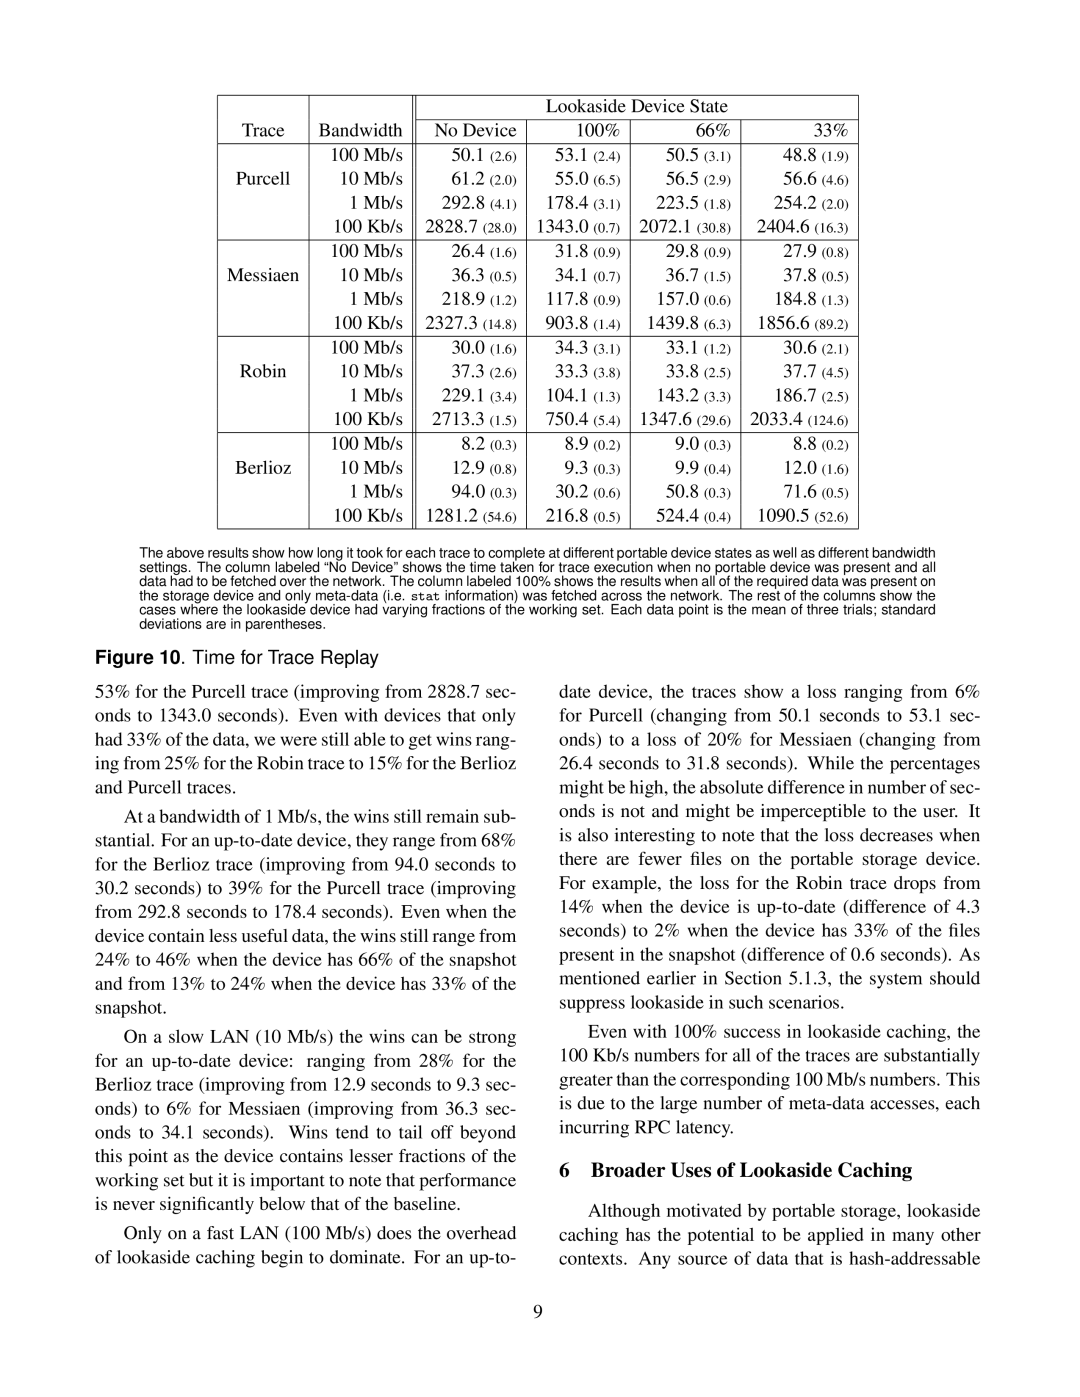
The above results show how long it took for each trace to complete at different portable device states as well as different bandwidth settings. The column labeled “No Device” shows the time taken for trace execution when no portable device was present and all data had to be fetched over the network. The column labeled 100% shows the results when all of the required data was present on the storage device and only
Figure 10. Time for Trace Replay
53% for the Purcell trace (improving from 2828.7 sec- onds to 1343.0 seconds). Even with devices that only had 33% of the data, we were still able to get wins rang- ing from 25% for the Robin trace to 15% for the Berlioz and Purcell traces.
At a bandwidth of 1 Mb/s, the wins still remain sub- stantial. For an
30.2seconds) to 39% for the Purcell trace (improving from 292.8 seconds to 178.4 seconds). Even when the device contain less useful data, the wins still range from 24% to 46% when the device has 66% of the snapshot and from 13% to 24% when the device has 33% of the snapshot.
On a slow LAN (10 Mb/s) the wins can be strong for an
Only on a fast LAN (100 Mb/s) does the overhead of lookaside caching begin to dominate. For an
date device, the traces show a loss ranging from 6% for Purcell (changing from 50.1 seconds to 53.1 sec- onds) to a loss of 20% for Messiaen (changing from
26.4seconds to 31.8 seconds). While the percentages might be high, the absolute difference in number of sec- onds is not and might be imperceptible to the user. It is also interesting to note that the loss decreases when there are fewer files on the portable storage device. For example, the loss for the Robin trace drops from 14% when the device is
Even with 100% success in lookaside caching, the
100 Kb/s numbers for all of the traces are substantially greater than the corresponding 100 Mb/s numbers. This is due to the large number of
6Broader Uses of Lookaside Caching
Although motivated by portable storage, lookaside caching has the potential to be applied in many other contexts. Any source of data that is
9
