100% |
|
|
|
|
|
|
|
|
|
|
|
|
|
|
|
|
|
|
|
|
|
|
|
|
|
|
80% |
|
|
|
|
|
|
|
|
|
|
|
|
|
|
|
|
|
|
|
|
|
|
|
|
|
|
60% |
|
|
|
|
|
|
|
|
|
|
|
|
|
|
|
|
|
|
|
|
|
|
|
|
|
|
40% |
|
|
|
|
|
|
|
|
|
|
|
|
|
|
|
|
|
|
|
|
|
|
|
|
|
|
20% |
|
|
|
|
|
|
|
|
|
|
|
|
|
|
|
|
|
|
|
|
|
|
|
|
|
|
0% |
|
|
|
|
|
|
|
|
|
|
|
|
|
|
|
|
|
|
|
|
|
|
|
|
|
|
.0 |
| .2 | .4 |
| .6 | .8 |
| .10 |
|
| 2 |
|
| 4 |
|
| 6 |
|
| 8 |
|
| 0 |
|
| 2 |
.4 | .4 | .4 | .4 | .4 |
|
| .1 |
| .1 |
| .1 |
| .1 |
| .2 |
| .2 | |||||||||
2 | 2 |
| 2 | 2 |
| 2 | .4 | .4 |
| .4 |
| .4 |
| .4 |
| .4 |
| .4 |
| |||||||
|
|
|
|
|
|
| 2 |
| 2 |
|
| 2 |
|
| 2 |
|
| 2 |
|
| 2 |
|
| 2 |
|
|
2.4.0 |
| 2.4.1 |
| 2.4.2 | 2.4.3 |
| 2.4.4 |
|
| 2.4.5 |
| 2.4.6 |
|
|
| 2.4.7 |
| |||||||||
2.4.8 |
| 2.4.9 |
| 2.4.10 | 2.4.11 |
| 2.4.12 |
|
| 2.4.13 |
| 2.4.14 |
|
| 2.4.15 | |||||||||||
2.4.16 | 2.4.17 |
| 2.4.18 | 2.4.19 |
| 2.4.20 |
|
| 2.4.21 |
| 2.4.22 |
|
|
|
|
| ||||||||||
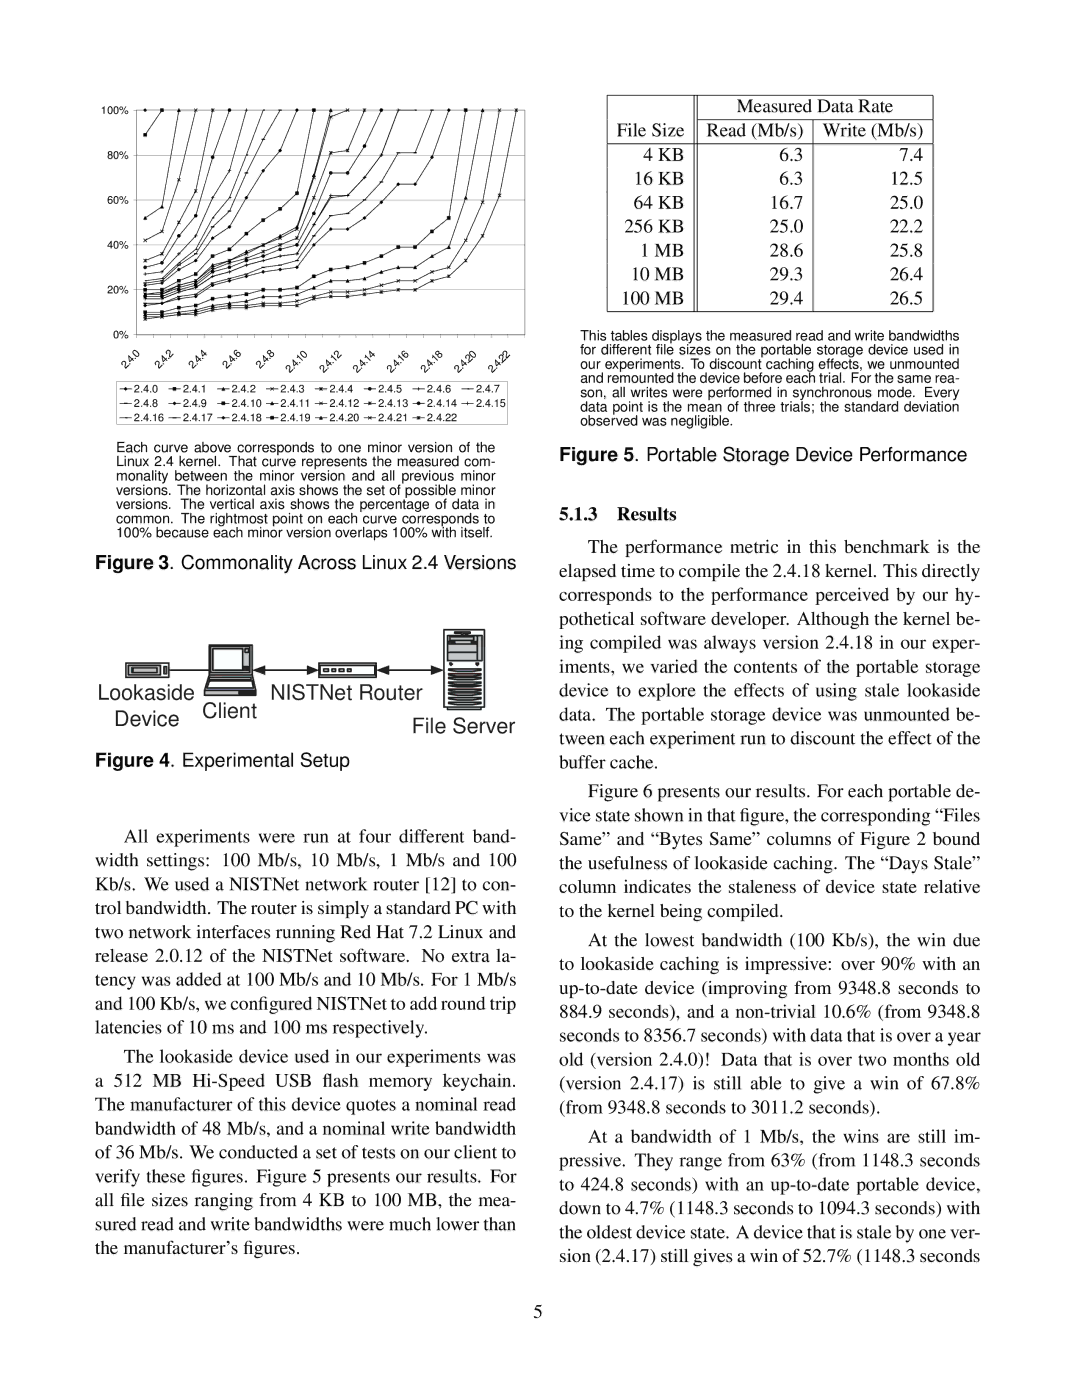
Each curve above corresponds to one minor version of the Linux 2.4 kernel. That curve represents the measured com- monality between the minor version and all previous minor versions. The horizontal axis shows the set of possible minor versions. The vertical axis shows the percentage of data in common. The rightmost point on each curve corresponds to 100% because each minor version overlaps 100% with itself.
Figure 3. Commonality Across Linux 2.4 Versions
Lookaside | Client NISTNet Router |
Device | File Server |
|
Figure 4. Experimental Setup
All experiments were run at four different band- width settings: 100 Mb/s, 10 Mb/s, 1 Mb/s and 100 Kb/s. We used a NISTNet network router [12] to con- trol bandwidth. The router is simply a standard PC with two network interfaces running Red Hat 7.2 Linux and release 2.0.12 of the NISTNet software. No extra la- tency was added at 100 Mb/s and 10 Mb/s. For 1 Mb/s and 100 Kb/s, we configured NISTNet to add round trip latencies of 10 ms and 100 ms respectively.
The lookaside device used in our experiments was a 512 MB
|
| Measured Data Rate | |
File Size | Read (Mb/s) | Write (Mb/s) | |
4 | KB | 6.3 | 7.4 |
16 | KB | 6.3 | 12.5 |
64 | KB | 16.7 | 25.0 |
256 | KB | 25.0 | 22.2 |
1 MB | 28.6 | 25.8 | |
10 MB | 29.3 | 26.4 | |
100 MB | 29.4 | 26.5 | |
This tables displays the measured read and write bandwidths for different file sizes on the portable storage device used in our experiments. To discount caching effects, we unmounted and remounted the device before each trial. For the same rea- son, all writes were performed in synchronous mode. Every data point is the mean of three trials; the standard deviation observed was negligible.
Figure 5. Portable Storage Device Performance
5.1.3Results
The performance metric in this benchmark is the elapsed time to compile the 2.4.18 kernel. This directly corresponds to the performance perceived by our hy- pothetical software developer. Although the kernel be- ing compiled was always version 2.4.18 in our exper- iments, we varied the contents of the portable storage device to explore the effects of using stale lookaside data. The portable storage device was unmounted be- tween each experiment run to discount the effect of the buffer cache.
Figure 6 presents our results. For each portable de- vice state shown in that figure, the corresponding “Files Same” and “Bytes Same” columns of Figure 2 bound the usefulness of lookaside caching. The “Days Stale” column indicates the staleness of device state relative to the kernel being compiled.
At the lowest bandwidth (100 Kb/s), the win due to lookaside caching is impressive: over 90% with an up-to-date device (improving from 9348.8 seconds to
884.9seconds), and a non-trivial 10.6% (from 9348.8 seconds to 8356.7 seconds) with data that is over a year old (version 2.4.0)! Data that is over two months old (version 2.4.17) is still able to give a win of 67.8% (from 9348.8 seconds to 3011.2 seconds).
At a bandwidth of 1 Mb/s, the wins are still im- pressive. They range from 63% (from 1148.3 seconds to 424.8 seconds) with an
5
