VISUAL TITRATION STATISTICS
Repeatability Standard Deviation, 1sr and
95 Percent Confidence Estimate
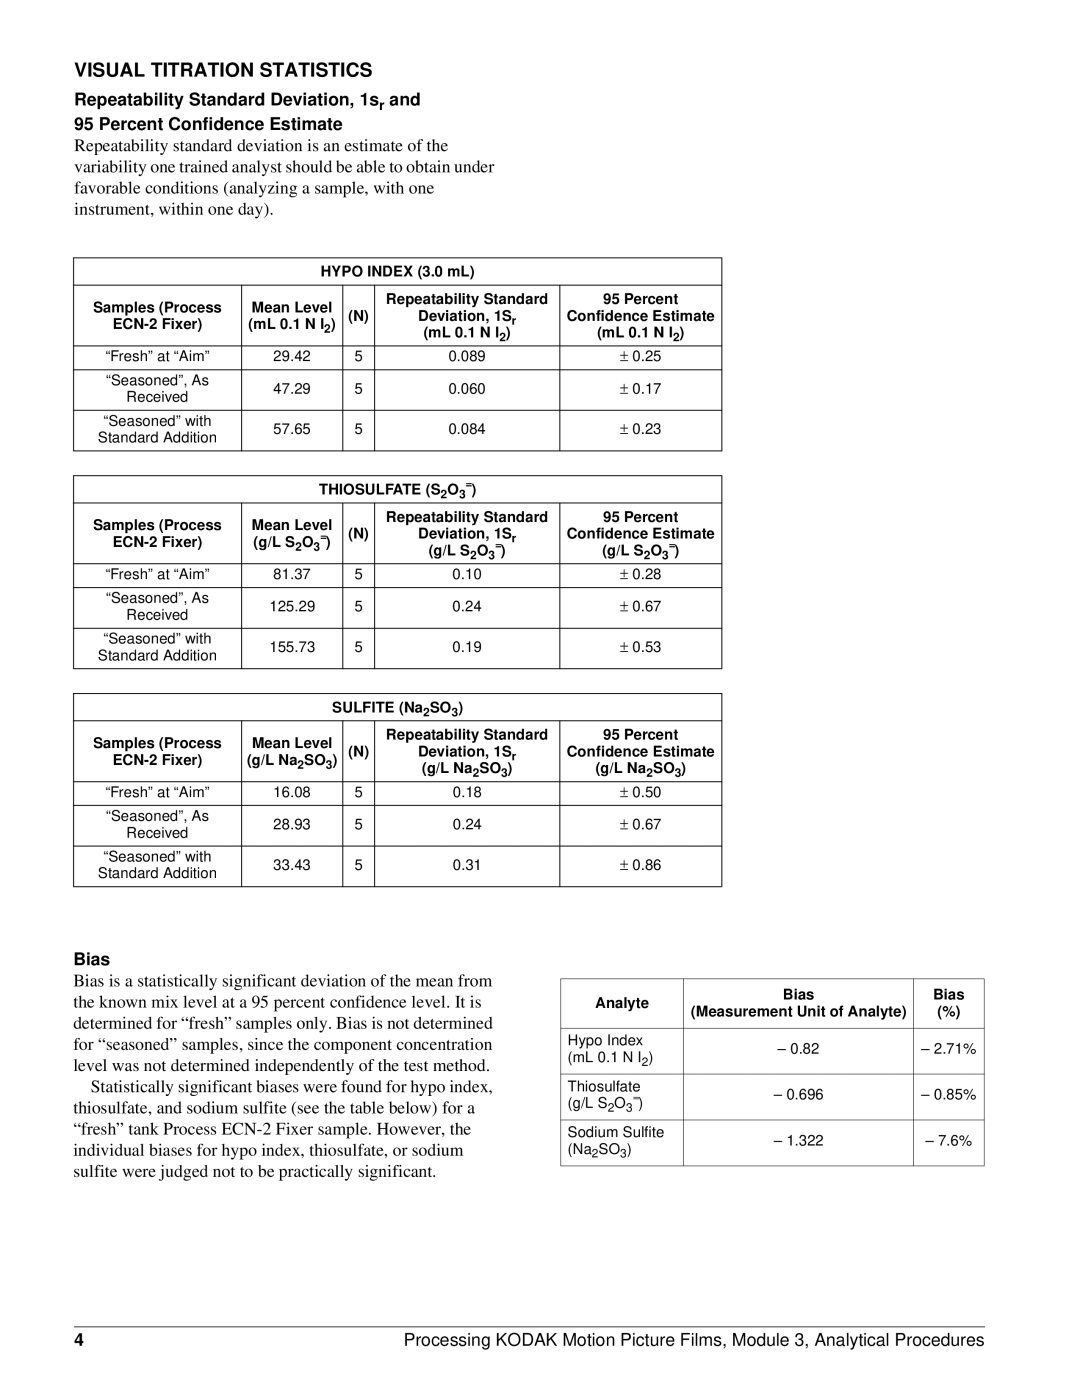
Repeatability standard deviation is an estimate of the variability one trained analyst should be able to obtain under favorable conditions (analyzing a sample, with one instrument, within one day).
HYPO INDEX (3.0 mL)
Samples (Process | Mean Level |
| Repeatability Standard | 95 Percent | ||
(N) | Deviation, 1Sr | Confidence Estimate | ||||
(mL 0.1 N I2) | ||||||
| (mL 0.1 N I2) | (mL 0.1 N I2) | ||||
|
|
| ||||
“Fresh” at “Aim” | 29.42 | 5 | 0.089 | ± | 0.25 | |
|
|
|
|
|
| |
“Seasoned”, As | 47.29 | 5 | 0.060 | ± | 0.17 | |
Received | ||||||
|
|
|
|
| ||
|
|
|
|
|
| |
“Seasoned” with | 57.65 | 5 | 0.084 | ± | 0.23 | |
Standard Addition | ||||||
|
|
|
|
| ||
|
|
|
|
|
| |
|
|
|
| |||
| THIOSULFATE (S2O3=) |
|
| |||
Samples (Process | Mean Level |
| Repeatability Standard | 95 Percent | ||
(N) | Deviation, 1S | Confidence Estimate | ||||
= | ||||||
(g/L S2O3 ) |
| = r |
| = | ||
|
|
| (g/L S2O3 ) | (g/L S2O3 ) | ||
“Fresh” at “Aim” | 81.37 | 5 | 0.10 | ± | 0.28 | |
|
|
|
|
|
| |
“Seasoned”, As | 125.29 | 5 | 0.24 | ± | 0.67 | |
Received | ||||||
|
|
|
|
| ||
|
|
|
|
|
| |
“Seasoned” with | 155.73 | 5 | 0.19 | ± | 0.53 | |
Standard Addition | ||||||
|
|
|
|
| ||
|
|
|
|
|
| |
|
|
|
| |||
| SULFITE (Na2SO3) |
|
| |||
Samples (Process | Mean Level |
| Repeatability Standard | 95 Percent | ||
(N) | Deviation, 1Sr | Confidence Estimate | ||||
(g/L Na2SO3) | ||||||
| (g/L Na2SO3) | (g/L Na2SO3) | ||||
|
|
| ||||
“Fresh” at “Aim” | 16.08 | 5 | 0.18 | ± | 0.50 | |
|
|
|
|
|
| |
“Seasoned”, As | 28.93 | 5 | 0.24 | ± | 0.67 | |
Received | ||||||
|
|
|
|
| ||
|
|
|
|
|
| |
“Seasoned” with | 33.43 | 5 | 0.31 | ± | 0.86 | |
Standard Addition | ||||||
|
|
|
|
| ||
|
|
|
|
|
| |
Bias
Bias is a statistically significant deviation of the mean from the known mix level at a 95 percent confidence level. It is determined for “fresh” samples only. Bias is not determined for “seasoned” samples, since the component concentration level was not determined independently of the test method.
Statistically significant biases were found for hypo index, thiosulfate, and sodium sulfite (see the table below) for a “fresh” tank Process
Analyte | Bias | Bias | |
(Measurement Unit of Analyte) | (%) | ||
| |||
|
|
| |
Hypo Index | – 0.82 | – 2.71% | |
(mL 0.1 N I2) | |||
|
| ||
Thiosulfate | – 0.696 | – 0.85% | |
(g/L S2O3=) | |||
Sodium Sulfite | – 1.322 | – 7.6% | |
(Na2SO3) | |||
|
|
4 | Processing KODAK Motion Picture Films, Module 3, Analytical Procedures |
