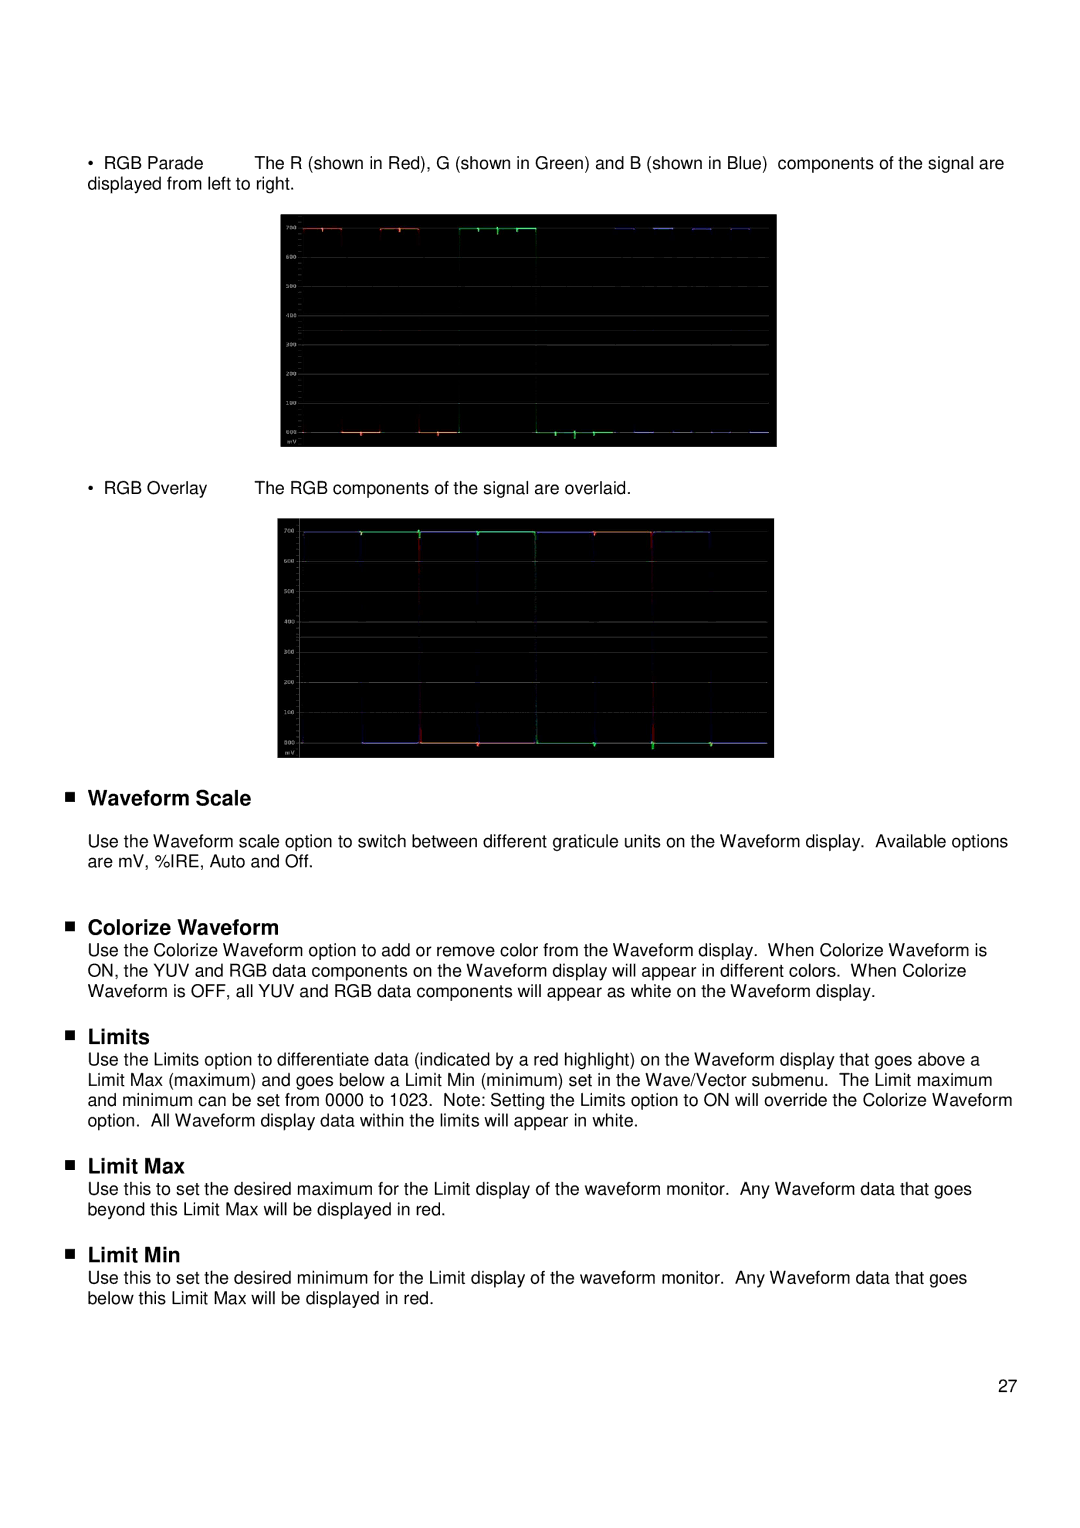
• RGB Parade The R (shown in Red), G (shown in Green) and B (shown in Blue) components of the signal are displayed from left to right.
• RGB Overlay | The RGB components of the signal are overlaid. |
■Waveform Scale
Use the Waveform scale option to switch between different graticule units on the Waveform display. Available options are mV, %IRE, Auto and Off.
■Colorize Waveform
Use the Colorize Waveform option to add or remove color from the Waveform display. When Colorize Waveform is ON, the YUV and RGB data components on the Waveform display will appear in different colors. When Colorize Waveform is OFF, all YUV and RGB data components will appear as white on the Waveform display.
■Limits
Use the Limits option to differentiate data (indicated by a red highlight) on the Waveform display that goes above a Limit Max (maximum) and goes below a Limit Min (minimum) set in the Wave/Vector submenu. The Limit maximum and minimum can be set from 0000 to 1023. Note: Setting the Limits option to ON will override the Colorize Waveform option. All Waveform display data within the limits will appear in white.
■Limit Max
Use this to set the desired maximum for the Limit display of the waveform monitor. Any Waveform data that goes beyond this Limit Max will be displayed in red.
■Limit Min
Use this to set the desired minimum for the Limit display of the waveform monitor. Any Waveform data that goes below this Limit Max will be displayed in red.
27
