Software
Nik Software, Inc All Rights Reserved
Trademark Information
Chapters at a Glance
System Requirements & Installation
Chapters at a Glance
Table of Contents
Folders Palette
Bird’s Eye
Toolbar
File Menu
Filter Menu
Window Menu
Appendix Supplied Color Profiles
RAW File Format Benefits
Introduction
Point Technology
Camera Relationship
Windows
System Requirements
Macintosh
Processor
Into Capture NX
Installation
Running Capture NX 2 in Trial Mode or Activating Product
Complete the installation process of Capture NX
Color Management Options
Nikon User Support Information U.S.A
Upgrading From Capture NX Version
Thank you for choosing a Nikon Digital Imaging product
Getting Started
Launching Capture NX
Convert Capture NX Version 1 Labels
Welcome Screen
Using Open Image
Using the Browser
To open an image using the browser, follow these steps
To open an image using Open Image…, follow these steps
Using Nikon Transfer
Using ViewNX
To open an image from ViewNX, follow these steps
Within Nikon Transfer, navigate to the Preferences tab
NEF RAW File Support
File Format Differences
Jpeg
Workflow Suggestions
Getting Started Workflow Suggestions
Printing a Single Image
Printing
Printing an Image to Fill the Current
Navigate to the File menu and select Print…
Click on the Select Layout option and choose 1 Photo on
Getting Started Printing
That the image will fit upon
Printing contact sheets
Ensure the Use Output Resolution option is not selected
Getting Started Printing
Adjustments dialog and let you create a settings file
Batch Processing
Applying a series of enhancements to a folder of images
Batch Process dialog
Processing Queue will be displayed and the batch
Data to an image
Images, add a name for the XMP/IPTC preset, and click OK
Preset that you saved in step
Converting NEF RAW files into Jpeg or Tiff files
To convert a folder of files from NEF RAW to Jpeg or Tiff
Navigate to the Batch menu and select Run Batch Process…
Page
To convert selected files from the Browser
Ctrl + Shift + S Windows or command + shift + S Macintosh
Click Start to begin converting the files
Shortcut
Preferences
Default Units
D1X RAW Default
General
Open With Application
Keep all Steps Active in Edit List
Default Save As
Folder for Temporary Data
Same as original file
Color Management
Use Black Point Compensation
Intent
Levels & Curves
Levels & Sampling
Dropper Sample Size
Grid
Display
Grid Color
Gridline Every
Image
Selection Overlay
Color
Opacity
Cache Settings
Browsing Cache
Editing Cache
Cache files saved within the Editor
Use Image Cache
Cache Files created in a Batch Process
Clear Cache
Available Presets
XMP/IPTC Presets
Bottom of the Available Presets window
Field Editor
Duplicate
New
Delete
Import
Label Compatibility
Labels
Manage Settings
Available Labels
Add
Reset Shortcuts
Default Workspaces
Workspaces
My Workspaces
Delete
Preferences
Interface
Overview
EBrowser
Metadata
Folders
Toolbar
Edit List
Browser
Multi-Purpose
Metadata
Edit
Creating Custom Workspaces
To create a custom workspace, follow these steps
Arrange the palettes and windows according to your taste
Type in the name of the new workspace and clickOK
Additional screen Sub-Menu
Working with Multiple Screens
Swap Workspaces
Desktop
Desktop Browser Metadata
Edit
Image Name
Image Window
Zoom Ratio
File Size
To turn soft proofing on, follow these steps
Soft Proof
Target Profile
Intent
Use Black Point Compensation
Window & Palette Functionality
Finding Palettes
Browser Overview
Browser
Using the Folders Palette
Using Open Folder in Browser
Opening a Folder of Images in the Browser
Click OK to open the folder in the browser
Filtering Tools
Navigating Within the Browser
Filter by Label
Previous Folder
File Type to Display
Filter by Rating
NEF only
Jpeg only
Sort By
Sorting Tools
Then Sort By
Options
Add Label
Labeling and Rating Toolbar
Add Rating
Images, follow these steps
Browser View Selector
Browser Header
Thumbnail Grid
Thumbnail Information Overlay
Edited Icon
Name
Rating Icon
XMP/IPTC Data Icon
Thumbnail List
File item
Extras
Opening Images from the Browser
Structure section
Folders Palette
Folder Structure Section
Favorite Folders Section
Adding Favorites
Deleting Favorites
File & Camera Information Section
Metadata Palette
Adding Image Information
XMP/IPTC Information Section
Information section
Select one or more images in the browser
Copying and Pasting Iptc Information
XMP/IPTC Information section
Click on the Apply button
Creating XMP/IPTC Presets
Metadata Palette XMP/IPTC Information Section
Managing XMP/IPTC Presets
Loading XMP/IPTC Presets
Iptc preset you would like to load into your images
Click OK
Activity Toolbar
Workspace Selector
Launch Nikon Transfer
Print
Tool Options Bar
Toolbar
Direct Select Tool
Key
Zoom Tool
Hand Tool
Straighten Tool
Rotate Tool
Toolbar Straighten Tool
Clicking and dragging within the image window again
Available within Capture NX 2 or perform a save.
Crop Tool
Keyboard
Click on the crop tool in the toolbar
Show Crop Assistance Grid
Crop Method
Free Crop
Fixed Aspect Ratio
Original Image
Black Control Point
Black Control Point Method
Luminosity Method
RGB Method
Advanced
Process removing multiple color casts
Neutral Control Point
Toolbar Neutral Control Point
Show Selection
Neutral Control Point Method
Color Picker
Affect Luminosity Method
White Control Point
White Control Point Method
Color Control Point
Toolbar Color Control Point
All
Color Control Point Mode
Method
Protect Details
Basic
Normal
Red-Eye Control Point
Advanced
Add a Color Control Point Ctrl + Shift + a Windows
To use the auto retouch brush, follow these steps
Auto Retouch Brush
Size
Auto retouch brush provides you with the following controls
Key Decrease brush size Increase brush size
Menus To use a selection control point, follow these steps
Selection Control Point
Lasso Tool
Lasso and Marquee Tools
Polygon Lasso Tool
Rectangle Marquee Tool
Lasso tools L key Marquee tools M key
Edge Softness
Selection Brush Tool
Well as the color, black, neutral, and white control points
To use the selection brush, follow these steps
Windows or Option key Macintosh
Brush Hardness
Pressure Controls
Opacity
Size
Opacity and Size
Linear Gradient Tool
Selection Gradient Tools
Radial Gradient Tool
White control points
Gradient Range
Gradient tool, or fill tool. The cursor will change
Fill / Remove Tools
Bird’s Eye
Bird’s Eye
Edit List
Introduction to the Edit List
Adjustments that you have previously made to your images
QShow/Hide
EReset Button
Triangles
RDelete Button
Version
Batch Menu
Adjustments to access often used enhancements for images
Settings available within your camera
Develop Section
To use the Develop section, follow these steps
White Balance
Camera Settings RAW only
Fine Adjustment slider
With the Fine Adjustment slider
Adjustment slider
Incandescent
None FL-G1 Flash FL-G2
Fine Adjustment
TN-A1
TN-A2
Set Gray Point
Use a single point
Marquee Sample
Corresponding Color mode settings for the D2X and D2XS
Picture Control Mode
Picture Control
Unchanged
Manage Picture Control Menu
Quick Adjust
Launch Picture
Control Utility
Filter Effects Monochrome only
Saturation and Hue Adjustment
Off
Yellow
Non-Picture Control
None Low Medium Low Normal Medium High Tone Compensation
Moderate Normal Enhanced Hue Adjustment
High
Active D-Lighting
Tone Curve
Quick Fix
White and Black Output Slider
Black Point Slider
Contrast
Exposure Compensation
Highlight Protection
Shadow Protection
Camera & Lens Corrections
Color Moiré Reduction RAW only
Image Dust Off RAW only
Auto Red-Eye
Auto Color Aberration
Vignette Control D-SLR only
Section to toggle auto color aberration reduction on or off
Distance information Distance Information
Camera Type G or D lens
Recorded Not recorded
Photo
Fill Color
Fisheye Lens
Adjust Section
Selection Information
Selection Display Control
Selection Control Points Section
Base Mask
Hide Selection
Show Overlay
Link Icon
Adjust & Filter pull-down menu
Enhancement Controls
Paint & Fill Mask Section
Channels
Opacity Mixer
Blending Mode
Deleting Steps and Enhancements
Working with the Edit List
Copying and Pasting Steps and Enhancements
Them
Swapping Enhancements
Linking Enhancements
To link enhancements, follow these steps
Enhancement to suit your taste
New Step Button
Please note Capture NX 2 will automatically create a new
Situations
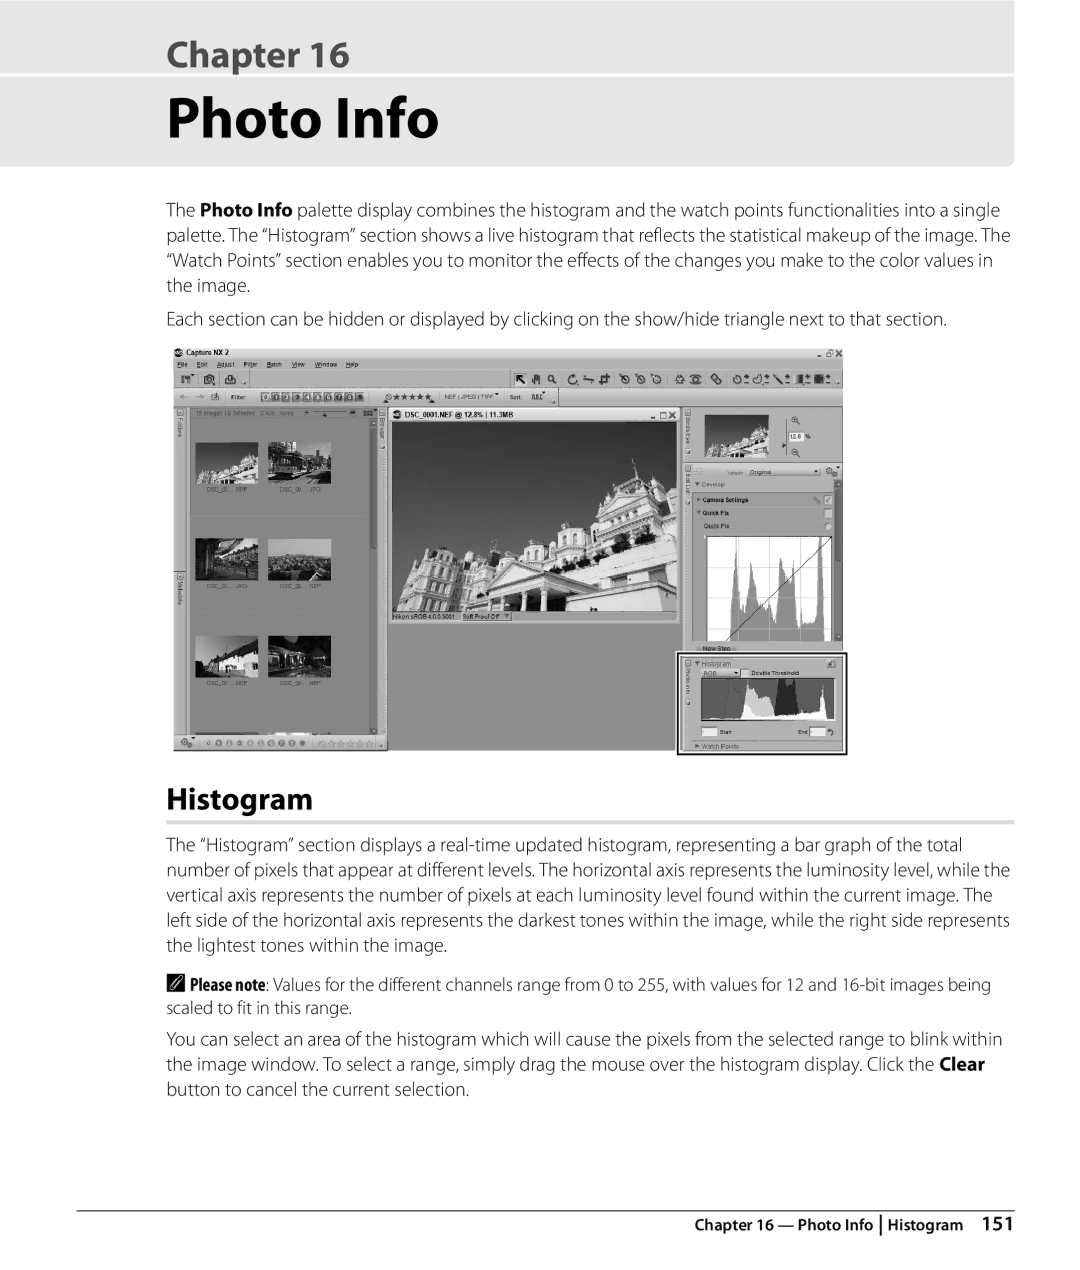
Histogram
Photo Info
Double Threshold
Channels
Red
Green
Watch Points
To use the Double Threshold feature, follow these steps
Clear
Toggle the Double Threshold option on and off Shift + T
Add Watch Point Button
Color Model
Sample Size
Color Picker
Color Triangle
Color Wheel
RGB Selection
Boxes
UColor
Preset Swatches
Eyedropper
ISwatches Show
Color Picker
File Menu
Open Image…
Open With…
Open Recent
Open Folder in Browser…
Launch Nikon Transfer…
Launch Camera Control Pro…
Embed ICC Profile
Save As…
Use Compression
Color Model
Bit Depth
Compression
None
Quality
Revert
Setup…
Protect File
Close
Click on this button to bring up the Page Setup dialog
Setup
Print…
Display and Page Forward and Back Buttons
Imprint Date Shot over Image
Print Information
Layout Tab
Color Management Tab
Image Profile
Printer Profile
Exit
Print to File
Select this option to quit Capture NX
Edit Menu
Undo
Redo
Cut
Copy
Paste
Delete
Duplicate
Rename
Delete key
Ctrl + Alt + a Windows Command + option + a Macintosh
Select All
Deselect All
Rotate
Flip
Degrees CW
Degrees CCW
Straighten
Delete key on your keyboard
Resample Image option enables you to change
Size / Resolution
Ctrl + Alt + S Windows Command + option + S Macintosh
Resample Image
Navigate to the Edit menu and select Fit Photo
Fit Photo
Want to resize a folder of images of mixed
Edit Menu Fit Photo
Edit Menu
Light Levels & Curves
Adjust Menu
Editing images
Channel Selector
Curve Editor
While a Levels & Curves step is active
Black, Mid Point, and White Sliders
Black and White Output Sliders
Black Point Slider
Mid-Point Slider
Auto Contrast
Show Before / After Histogram
Set White Point
Set Neutral Point
Light Contrast / Brightness
Brightness
Light Auto Levels
Auto Levels Method
Correct Contrast
Correct Color Cast
Light D-Lighting
Faster HS Method
Better Quality HQ Method
Color LCH
Adjust Menu Color LCH
Different effects on the image
Master Lightness
Enhancement
While a LCH step is active
Adjust Menu Color LCH
0Reset All
Reset Current
Cancel
White Point
QHue Map
Color Lightness
Color identified with the anchor point
Delete key
Chroma
Reset All
Temporary
Chroma channel provides you with the following controls T y
Hue
Rotation To 120 to
Hue channel provides you with the following controls R t
Red
Color Color Balance
Green
Blue
Color Saturation / Warmth
Color Color Booster
Focus High Pass
Focus Gaussian Blur
Radius
High Pass tool provides you with the following controls
Focus Unsharp Mask
Unsharp Mask tool increases the apparent sharpness
To use the Unsharp Mask tool, please follow these steps
Unsharp Mask tool provides you with the following controls
Color
Intensity
Correct Distortion Control
Threshold
Correction
Fill Color
Correct Color Aberration Control
Red Cyan
Blue Yellow
Noise Reduction tool provides you with the following control
Noise Reduction
Edge Noise Reduction
Sharpness
Apply Profile
Color Profile
Profile Selector
Use the following controls to use the Apply Profile method
Convert to Profile
Color detail
Photo Effects
Filter Menu
Enhance Photo
Brightness
Cyan Red
Black and White
Magenta Green
Yellow Blue
Following controls are available within the Sepia method
Sepia
Following controls are provided within the Tinted method
Tinted
Contrast Color Range
Add Grain / Noise
Grain Strength
Grain Color
Blending Mode
Colorize
Black and White Conversion
Color Filter Strength
Filter Hue
Third-Party Plug-Ins
Run Batch Process
Batch Menu
Batch Process
Source
Conflict Management
Apply Settings
Rename
Select File Format
Watched Folder
Destination
Watched Folder
Run Process Immediately
Use Settings Files Browse…
Run Process Every
Skip & Continue
File Naming Dialog
Prefix
Background
Middle
Processing Queue
Suffix
Original Name
Log
Queued
Clear From List
File Name
Paste Adjustments
Copy Adjustments
Close When Done
Notify When Complete
Load Adjustments
Save Adjustments
Load XMP/IPTC Preset
Save XMP/IPTC Preset
Copy Iptc Info
Paste Iptc Info
Selection Display
View Menu
Hide Selection
Options provided in the Selection Display sub-menu
Show Active Selection
Show All Control Points
Show Watch Points
Show Overlay
Show Grid
When working with images captured by a Nikon camera
Show Focus Point
Show Lost Highlights
Shift + H
Show Lost Shadows
Fit to Screen
View at 100%
Zoom
Select this option to zoom one step into the active image
Full Screen
Zoom Out
Presentation
Select this option to zoom one step out of the active image
Tab key
Hide Palettes
Compare in Browser
Compare Images
Compare in Editor
Compare with Original
Window Menu
Bird’s Eye
Toolbar
Edit List
Photo Info
Contents
Help Menu
Technical Support
You want to access the welcome screen again
Update Capture NX
Show Welcome Screen
About Capture NX
Appendix Short-cuts
Filter by Rating 2 Stars
Filter by Rating 1 Star
Filter by Rating 3 Stars
Filter by Rating 4 Stars
Edit Menu
File Menu
Adjust Menu
Filter Menu
View
Help
Window Menu
Appendix Short-cuts
Standard RGB Profiles Supplied in Capture NX
Profiles with a Gamma Value
SRGB NKsRGB.icm Windows/ Nikon sRGB 4.0.0.3001 Macintosh
Gamut
Technical Data for RGB Profiles Supplied with Capture NX
Capture NX 2 and Adobe Photoshop Color Profiles
Nikon Message Center Agent
Appendix Additional Notices
White Balance
Camera Adjustments
Exposure Compensation
Color Mode
Image Dust Off
Opening Images
Vignette Control
RAW Images Created with the D1X
008 × 1,960 pixels and ten megapixels 4,016 × 2,616
Saving Images
Color Management Preferences Windows
Default Color-Space Profiles
Color Management Preferences Macintosh
Multiple Displays
Levels & Curves
Lighting
Unsharp Mask
Color Aberration Control
Appendix Additional Notices
Index
Jpeg
Tiff
264
Life-Long Learning
Contact Information
6MS54911-02