Manuals
/
REI
/
Kitchen Appliance
/
Ventilation Hood
REI
manual
MDC-2100/MDC-900, Selecting A Signal With The Mdc Oscor
Models:
MDC-900
1
9
16
16
Download
16 pages
63.82 Kb
6
7
8
9
10
11
12
13
Specification
Signal identification Process
Page 9
Image 9
Page 8
Page 10
Page 9
Image 9
Page 8
Page 10
Contents
MDC-900 MDC-2100
MDC-2100/MDC-900
OWNER’S GUIDE
RESEARCH ELECTRONICS INTERNATIONAL 455 Security Drive
TABLE of FIGURES
TABLE of CONTENTS
STORING A SIGNAL IN THE MDC FREQUENCY RANGE
FIGURE 11 ANALYZE MODE USING THE MDC OSCOR
Figure 1 MDC-2100 MICROWAVE DOWNCONVERTER
INTRODUCTION
Filter A
ANTENNA BAND
Filter B
Filter A & B
Installing the MDC-2100/MDC-900
Signal identification Process
Operational Control of the MDC-2100/MDC-900
OSCOR Version
Press F4/MDC Anlz
Viewing Bands 1, 2 and
Press SWEEP/ANALYZE
Press F4/Identify see Figure 6B
Figure 6A ANALYZING AN MDC SIGNAL OSCOR
OSCOR Sweep and Analyze Modes with the MDC
Figure 6B ANALYZING AN MDC SIGNAL OSCOR
FIGURE 7 USING “IDENTIFY” TO VERIFY A SIGNAL OSCOR
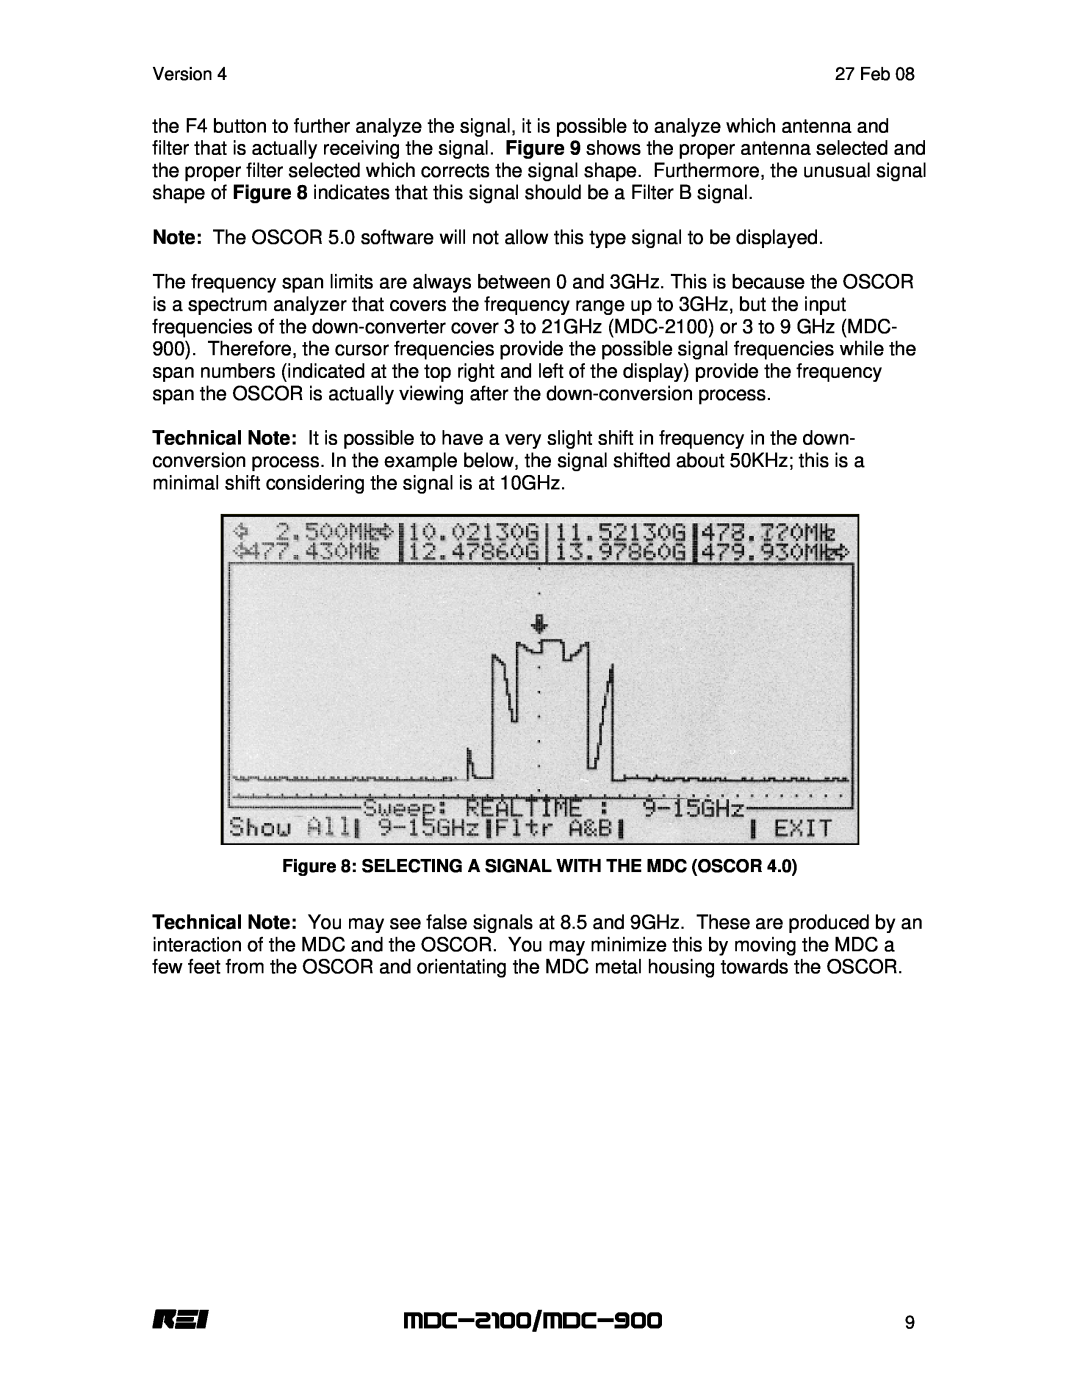
Figure 8 SELECTING A SIGNAL WITH THE MDC OSCOR
Storing a Sweep Span with the MDC
Example of a Desired Frequency
Storing a Signal in the MDC Frequency Range
Recommended Implementation
Span
Microwave Transmission Considerations for the MDC
it is absolutely necessary in order to save time. A good rule of thumb is to assume that the MDC has an antenna pattern that is about 100 degrees wide. In other words, it is necessary to point the MDC in at least 4 different directions around the room to cover the perimeter. Also, the MDC should be pointed up and possibly moved around the room to cover the ceiling, and down to cover the floor. Furthermore, if you expect a very sophisticated threat, it is recommended to point the MDC into ducting, above ceiling tiles, and in any enclosed spaces in which it would be possible to place a transmitter with a high gain antenna. It is highly recommended that the “Show All” mode of operation for the MDC-2100 be utilized MDCA-all and MDCB-all if using OSCOR 5.0. When a signal is detected, the user can then manually select the different antenna bands and filters to further investigate the signal. Or, the user can simply go to the analyze mode and allow the MDC to determine the operational frequency of the transmitter. Also, it is not recommended to use the MDC with the OSCOR automatic mode unless the MDC directional characteristics are taken into consideration. If running the OSCOR and MDC in the automatic mode, take care to enable the appropriate MDC spans. To maximize usage of the MDC, include MDC 3-21GHz Filter A and MDC 3-21GHz Filter B in your span list For OSCOR 4.0 users, set span to All Bands A&B
Using the MTU-2100 Microwave Test Unit
Specifications
MDC-2100/MDC-900 SPECIFICATIONS
MDC-2100
MDC-900
Technical Bulletin
Top
Page
Image
Contents