EL-9900 specifications
The Sharp EL-9900 is a remarkable scientific calculator that exhibits a fusion of advanced features, cutting-edge technology, and an ergonomic design tailored for both students and professionals. One of the standout characteristics of the EL-9900 is its extensive range of functions, boasting over 550 built-in calculations that cover various mathematical and scientific disciplines. This calculator is particularly popular among engineering and physics students due to its ability to handle complex calculations with ease.One of the key features of the EL-9900 is its 2-line display, which allows users to view both the input and the result simultaneously. This dual display enhances usability, especially when dealing with intermediate steps in calculations. The calculator also includes a built-in 12-digit LCD screen, which ensures clarity and precision in reading numbers, making it easier for users to work for extended periods without straining their eyes.
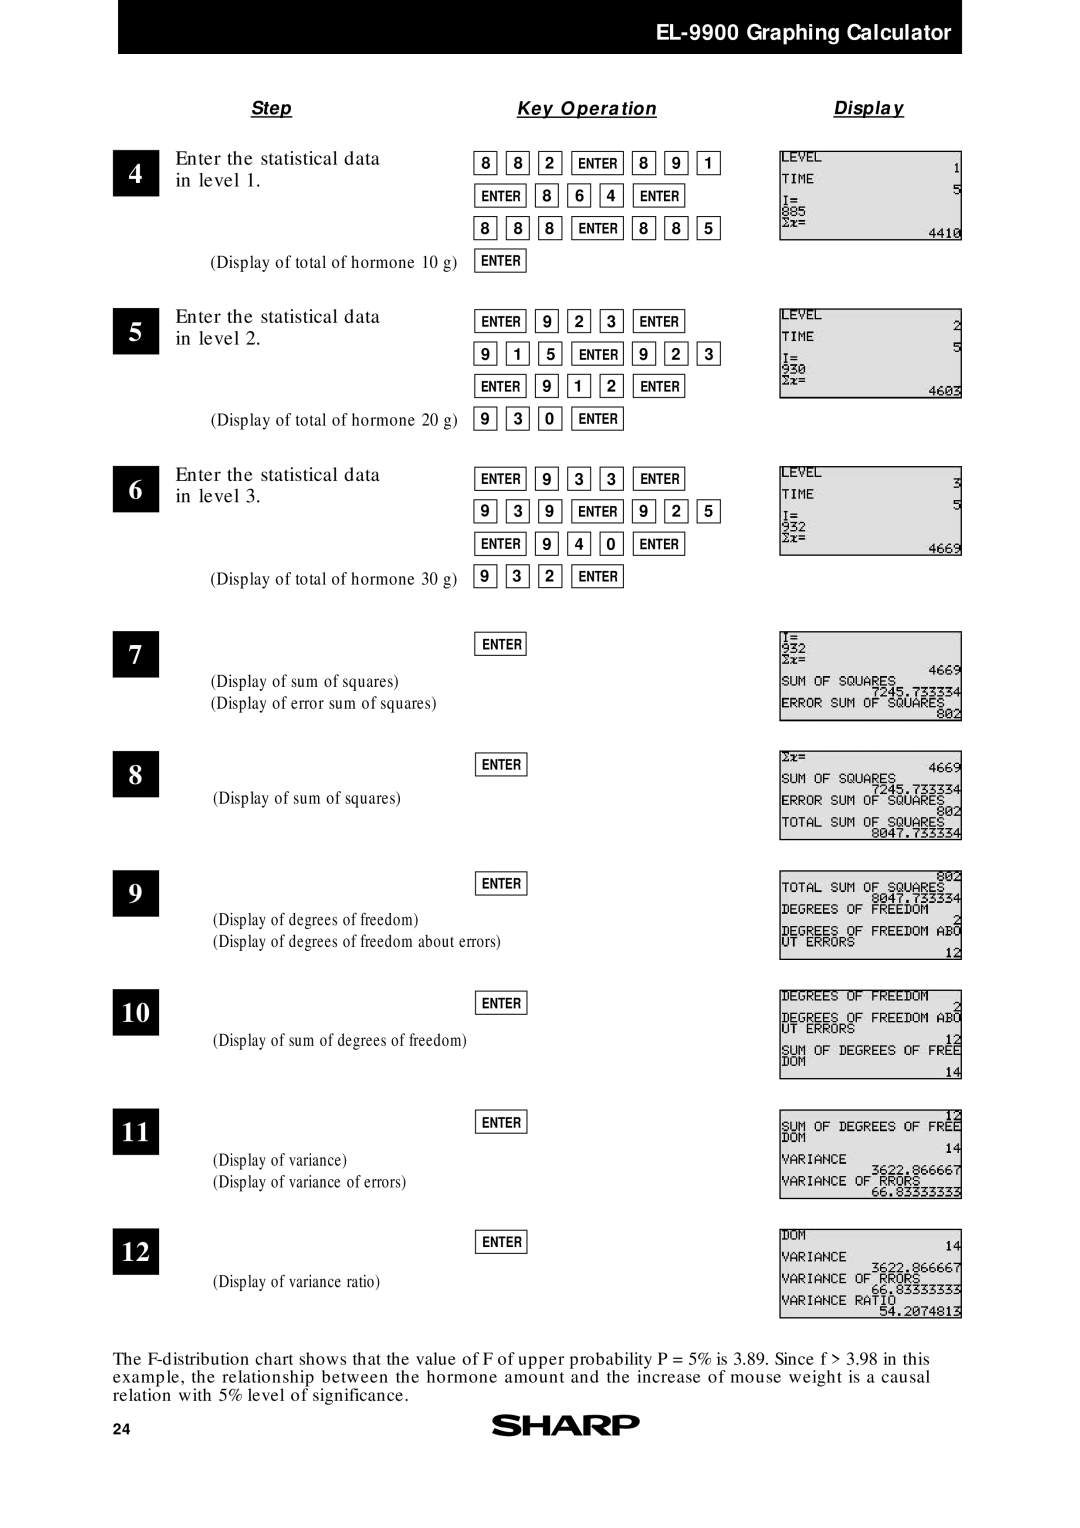
The EL-9900 is equipped with a wide array of mathematical functions, including trigonometric, logarithmic, and exponential functions. Notably, it supports fraction calculations, statistical analyses, and unit conversions. Its advanced programming capabilities, such as 36 programmable functions and the ability to store data, further enhance its functionality, allowing users to create custom calculations tailored to specific needs.
One of the more modern technologies incorporated into the EL-9900 is its solar-powered function, which is complemented by a battery backup, ensuring that the device remains operable in varied lighting conditions. This environmentally friendly design reduces the need for frequent battery replacements, making it a cost-effective choice for users.
In terms of design, the Sharp EL-9900 boasts a slim profile and lightweight construction, which makes it portable and easy to carry. Its durable casing ensures that it can withstand the rigors of daily use, whether in a classroom setting or a professional environment.
Overall, the Sharp EL-9900 stands out as a versatile scientific calculator packed with features designed to meet the needs of students and professionals alike. Its robust functionality, clear display, and user-friendly design make it a reliable tool for anyone engaged in mathematical and scientific pursuits. Whether used for basic calculations or advanced problem-solving, the EL-9900 remains a powerhouse in the realm of scientific calculators.

