Sharp EL9900 manual Change to parametric mode

Page 47

EL-9900 Graphing Calculator

Step & Key Operation

Display

Notes

2-1

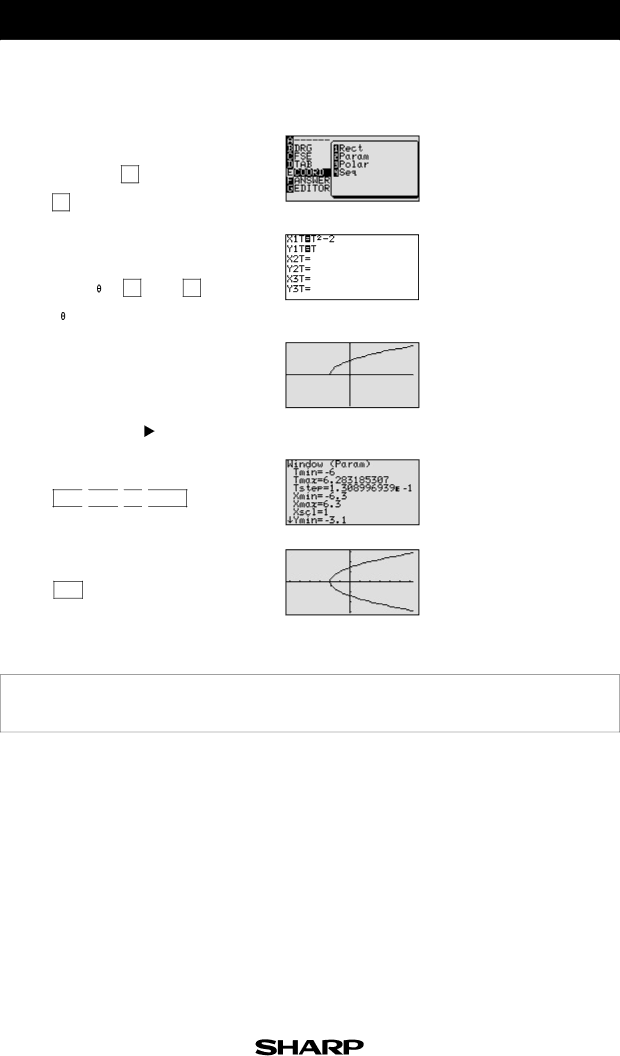
Change to parametric mode.


2nd F


SET UP


E


2


2-2

Rewrite x = y 2 -2 in parametric form.


Let y = T and substitute in x


Enter X1T = T 2 -2 and Y1T = T.


= y 2 - 2, to obtain x = T 2- 2.


x2


2


Y=


X/ /T/n


ENTER


X/ /T/n


2-3View the graph. Consider why only half of the parabola is drawn.

(To understand this, use Trace fea- ture.)

GRAPH

(

TRACE


)

2-4Set Tmin to -6.

WINDOW (-) 6 ENTER

The graph starts at T =0 and increases. Since the window setting is T 0, the region T < 0 is not drawn in the graph.

2-5View the complete parabola.

GRAPH

The calculator provides two methods for graphing parabolas, both of which are easy to perform.

12-1

Image 47
Contents EL-9900 Contents Always read Before Starting Read this firstIntroduction Using this HandbookExample Fractions and DecimalsBefore Pie Charts and ProportionsSlope and Intercept of Linear Equations 1Enter the equation y = x for Y2 Parallel and Perpendicular Lines 2View the graphs Slope and Intercept of Quadratic Equations 1Change the equation in Y2 to y = x 2+2 1Access the Solver feature This screen will appear a few 4Enter the values L=15,000, I=0.09, N=48 Access the Solver feature 200 15 π 10π1Access the Solver feature 5Solve for the height and enter a starting point Graphing Polynomials and Tracing to Find the Roots 1Move the tracer near the left-hand root = x 4 + x 3 5x 2 3x + Graphing Polynomials and Jumping to Find the RootsFind the next root Solving a System of Equations by Graphing or Tool Feature 1Access the Tool menu. Select the number of variables Entering and Multiplying Matrices 1Multiply the matrices a and B together at the home screen Solving a System of Linear Equations Using Matrices 2Calculate B-1C Solving Inequalities EL-9900 Graphing Calculator = 2x 5 Solving Double Inequalities2x 5 ≥ = 2x 5 and y = 7 intersect at 6,7 + y ≤ + y ≤2x + y ≥ + 2y ≤ 1 y ≤ +y ≥ 4 y ≥ 4 x + 2y ≤ 1 x 2 + y ≥Continuing key operations omitted If x ≥ Slope and Intercept of Absolute Value Functions3View the graph Solve an absolute value equation 5 4x = Solving Absolute Value Equations= 10, y = Solving Absolute Value Inequalities2nd F Calc 2 x = = 9.999999999 Note +3 1+3 Evaluating Absolute Value FunctionsMath Graphing Rational Functions + 1x Solving Rational Function Inequalities = y 2 + 2 = y = +√ x + Graphing ParabolasChange to parametric mode 2x + y+22 = Graphing CirclesGraph x 2 2x + y 2 + 4y = 2x + y 2 + 4y =For Y1 = Y1 2 for Y2, and y = -Y1 -2 for Graphing Ellipses View the graph Graphing Hyperbolas Zoom out the screen Key pad for the Sharp EL-9900 Calculator Key pad for the Sharp EL-9900 Calculator Sharp Graphing Calculator Step Sharp Corporation OSAKA, Japan