Step & Key Operation | Display | Notes |
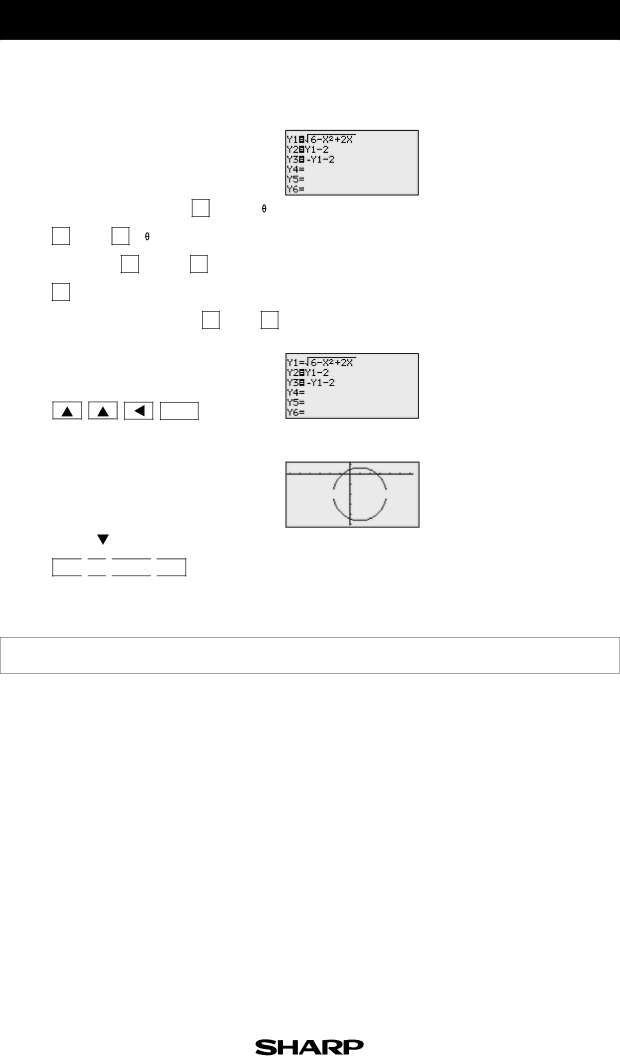
Enter y = √ |
|
|
|
| |||||||||||||||||||||
6 - x 2 + 2x | for Y1, |
| |||||||||||||||||||||||
| y = Y1 - 2 for Y2, and y = | ||||||||||||||||||||||||
| Y3. |
|
|
|
|
|
|
|
|
|
|
|
|
|
|
|
|
|
|
|
|
| |||
|
|
|
|
|
|
|
|
|
|
|
|
|
|
|
|
|
|
|
|
|
|
|
|
|
|
|
| Y= |
| CL |
| 2nd F |
| √ |
|
| 6 |
| — |
| X/ /T/n | ||||||||||
|
| x2 |
|
|
|
|
| 2 |
|
|
|
|
|
|
|
|
|
|
|
|
|
|
|
| |
|
|
|
| + |
| X/ /T/n |
| ENTER |
| CL |
|
| |||||||||||||
|
|
|
|
|
|
|
|
|
|
|
|
|
|
|
|
|
|
|
|
| |||||
|
| 2nd F |
| VARS |
| A |
|
| ENTER |
|
| 1 |
| — |
|
| |||||||||
| 2 |
|
|
|
|
|
|
|
|
|
|
|
|
|
|
|
|
|
|
|
|
|
| ||
|
|
| ENTER |
|
|
|
|
|
|
|
|
|
|
|
|
|
|
|
|
|
| ||||
|
|
|
|
|
|
|
|
|
|
|
|
|
|
|
| 1 |
|
|
|
| 2 | ||||
|
| - |
|
|
| 2nd F |
| VARS |
| ENTER |
| — | |||||||||||||
|
| ( ) |
|
|
|
|
|
|
|
|
|
|
|
|
|
| |||||||||
"Turn off" Y1 so that it will not |
| ||||||||||||||||||||||||
| graph. |
|
|
|
|
|
|
|
|
|
|
|
|
|
|
|
|
|
| ||||||
ENTER
WINDOW |
|
| (3 times) | — |
| 2 |
| ENTER |
— ![]()
![]() 2
2 ![]()
![]() ENTER
ENTER ![]()
![]() GRAPH
GRAPH
Notice that if you enter
y = √ 6 - x 2 + 2x - 2 for Y1 and y = - Y1 for Y2, you will not get the graph of a circle because the “± ” does not go with the
Notice that “=” for Y1 is no longer darkened. You now have the top portion and the bottom portion of the circle in Y2 and Y3.
➝
Graphing circles can be performed easily on the calculator display.