Mac OS X Server
Apple Computer, Inc Apple Computer, Inc. All rights reserved
Contents
Preparing the Target Volume for a Clean Installation
Installing Server Software
Locating Computers for Installation
Specifying the Target Computer Volume
Managing Network Port Configurations
Setting Network Preferences
Configuring Network Interfaces
Viewing or Changing Media Settings
Unmounting Volumes
Working with Disks and Volumes
Mounting and Unmounting Volumes
Mounting Volumes
141 Listing Connected Users 142
163
171
214 Apache Tomcat JBoss Server 215 MySQL Database
Contents
265 Configuring the Active Directory Plug-In
Glossary
Appendix
Index
Contents
About This Guide
Understanding Notation Conventions
Using This Guide
Commands and Other Terminal Text
Command Parameters and Options
Commands Requiring Root Privileges
Default Settings
Earlier versions of the server
Install Mac OS X Server and set it up for the first time
Create and manage users, groups, and computer lists. Set up
This guide Tells you how to
Set up and manage QuickTime streaming services
Manage directory and authentication services
This guide Tells you how to
Opening Terminal
Executing Commands
Folder
Specifying Files and Folders
Path string Description
Test.c file in the current folder
Redirecting Input and Output
Modifying Flow Control
Redirect Description
Following command in a Terminal window
Using Environment Variables
Executing Commands and Running Tools
Searching for Text Within a File
Correcting Typing Errors
Repeating Commands
Including Paths Using Drag and Drop
An example of a configured crontab file
Terminating Commands
Scheduling Tasks
Viewing Command Information
Sending Commands to a Remote Computer
To access a man
$ hdiutil help $ dig -h $ diff --help
Executing Commands
How SSH Works
Understanding Secure Shell
Password-Less Logins Using SSH Keys
Updating SSH Key Fingerprints
Controlling Access to SSH Service
What is an SSH Man-in-the-Middle Attack?
You’re prompted for the user’s password
Connecting to a Remote Computer
Using SSH
To access a remote computer using ssh
To access a remote computer using telnet
Using Telnet
To enable Telnet access
To disable Telnet access
To use installer to install Mac OS X Server software
Installing Server Software
Locating Computers for Installation
To list computers on the local network
Specifying the Target Computer Volume
Preparing the Target Volume for a Clean Installation
To list volumes available for server software
Installing from Multiple CDs
Automating Server Setup
Restarting After Installation
To save a configuration file during server setup
Creating a Configuration File
Installing Server Software and Finishing Basic Setup
To provide a passphrase interactively
Working with an Encrypted Configuration File
Customizing a Configuration File
To provide a passphrase in a file
Sample Configuration File
Installing Server Software and Finishing Basic Setup
Installing Server Software and Finishing Basic Setup
Storing a Configuration File in an Accessible Location
Configuring the Server Remotely from the Command Line
Using the serversetup Tool
Changing Server Settings
Using the serveradmin Tool
To set the server software serial number
Viewing, Validating, and Setting the Software Serial Number
General and Network Preferences
To display the server’s software serial number
To validate a server software serial number
To check for available updates
To install an update
Updating Server Software
Moving a Server
Installing Server Software and Finishing Basic Setup
To restart a remote computer immediately
Restarting a Computer
Automatic Restart
To restart the local computer
Shutting Down a Computer
Changing a Remote Computer’s Startup Disk
Manipulating Open Firmware Nvram Variables
Folder Usage
Monitoring and Restarting Critical Services
Restarting or Shutting Down a Computer
To change the computer name
Viewing or Changing the Computer Name
Viewing or Changing the Date and Time
To display the computer name
Viewing or Changing Network Time Server Usage
Viewing or Changing the System Date
Viewing or Changing the System Time
Viewing or Changing the System Time Zone
Viewing or Changing Sleep Settings
Viewing or Changing the Energy Saver Settings
Viewing or Changing Automatic Restart Settings
Viewing or Changing the Startup Disk Settings
Changing the Power Management Settings
Viewing or Changing Apple Event Response
Viewing or Changing the Sharing Settings
Viewing or Changing the International Settings
Viewing or Changing Remote Login Settings
Disables the buttons and 1 enables the buttons
Viewing and Changing the Login Settings
To view the current setting
Configuring Network Interfaces
Setting Network Preferences
Viewing Port Names and Hardware Addresses
Managing Network Interface Information
Viewing or Changing MTU Values
Activating Port Configurations
Managing Network Port Configurations
Viewing or Changing Media Settings
Creating or Deleting Port Configurations
To change the order of the port configurations
Managing TCP/IP Settings
Changing a Server’s IP Address
Run the changeip tool
To change a server’s IP address
To change the IP address of a standalone server
To change TCP/IP settings for a particular port or device
To list TCP/IP settings for a configuration
To view TCP/IP settings for port en0
To view TCP/IP settings for a particular port or device
Viewing or Changing DNS Servers
Working with VLANs
Enabling TCP/IP
Ieee 802.3ad Ethernet Link Aggregation
Configuring Ethernet Link Aggregation
Configuring a Network Interface
Managing Snmp Settings
Managing AppleTalk Settings
Immediately above it, add this line
Installing Snmp
Open the /etc/hostconfig file Locate the line
Starting Snmp
To stop snmpd
Configuring Snmp
To start the snmp agent manually
To identify the process id
Other options in the menu you were working in are
Collecting Snmp Information from the Host
To view the snmp.conf file
To start snmpd, execute this as root
Viewing or Changing FTP Proxy Settings
Managing Proxy Settings
Viewing or Changing Gopher Proxy Settings
Viewing or Changing Web Proxy Settings
Viewing or Changing Secure Web Proxy Settings
Viewing or Changing Streaming Proxy Settings
Viewing or Changing Socks Firewall Proxy Settings
Managing AirPort Settings
Viewing or Changing Proxy Bypass Domains
Computer Name
Managing the Computer, Host, and Bonjour Names
Hostname
To display the server’s Bonjour name
Managing Preference Files and the Configuration Daemon
Command displays 0 if the name was changed
Bonjour Name
To set the hostname of a system
Changing Network Locations
To get the hostname of a system
To view the current locations
This example, the network location will switch to AirPort
Computer will respond with output similar to the following
Understanding Disks, Partitions, and the File System
Mounting and Unmounting Volumes
To view a list of currently mounted file systems
Mounting Volumes
Unmounting Volumes
To unmount a volume
To display disk information
To enable diskspacemonitor
Displaying Disk Information
Monitoring Disk Space
Reclaiming Disk Space Using Log-Rolling Scripts
Erasing, Modifying, Verifying, and Repairing Disks
To mount a drive
To get mount info about a partition
To erase and repartition a disk
Partitioning a Disk
To format a Mac OS Extended volume as case-sensitive HFS+
Command Description
Partitioning and Formatting Disks
To fomat a disk
Checking for Disk Problems
Labeling a Disk
Formatting a Disk
To enable journaling
Checking to See If Journaling is Enabled
Enabling Journaling for an Existing Volume
To see if journaling is enabled
Enabling and Disabling Spotlight
Enabling Journaling When You Erase a Disk
Understanding Spotlight Technology
Disabling Journaling
To view the metadata of a file
To enable Spotlight on your server
Performing Spotlight Searches
Restart your server
Controlling Spotlight Indexing
Managing RAID Volumes
To image a boot volume
Imaging and Cloning Volumes Using ASR
To repair a failed mirror
To restore a volume from an image
Understanding Accounts
Working with Users and Groups
To create an local administrator user with a specific UID
Administering and Creating Accounts
Creating a Local Administrator User Account for a Server
To create a local administrator user account
To create a domain administrator user account
Creating a Domain Administrator User Account
To see if a user is a server administrator
Checking a User’s Administrator Privileges
Creating a Nonadministrator User Account
To find the Guid of the administrator user
Specify the user ID, replacing 1234 with the new user’s ID
102
Review the Guid for a particular user
Retreiving a User’s Guid
Removing a User Account
To retrieve a user’s Guid
Disable the user account by entering the following command
Revoking a User’s Right to Access His or Her Account
To prevent a user from logging
To terminate all of a user’s processes
To reenable a user account that is disabled
Checking a Server User’s Name, UID, or Password
To change a user account attribute to a new value
Modifying a User Account
Attribute Description
To create a mobile account
Creating a Mobile User Account
To create a home folder for a particular user
Managing Home Folders
To flush the cache
Creating a User’s Home Folder
To mount a user’s shared home directory on an AFP server
Administering Group Accounts
To create a home folder for users in the local domain
Mounting a User’s Home Folder
To add a group account
Creating a Group Account
Removing a Group Account
You can remove group accounts by using the dscl tool
To remove a group account
Adding a User to a Group
You can add users to a group using the dscl tool
To add a user to a group
Removing a User from a Group
You can remove users from a group by using the dscl tool
To remove a user from a group
Review the new settings of the group
To create a nested group
Creating and Deleting Nested Group
To verify a nested group
To delete a group
Editing Group Records
To unnest a group
To display the information about a particular group
See the CreateGroupFolder man page for more information
Viewing the Workgroup a User Selects at Login
Creating a Group Folder
To create a group folder
To import users and groups
Importing Users and Groups
Writing a Record Description
Creating a Character-Delimited User Import File
Number of attributes in each account record
121
Using the StandardGroupRecord Shorthand
Using the StandardUserRecord Shorthand
An example user account looks like this
Some examples of permission settings
Setting Permissions
Viewing Permissions
Use one of the following values to set the permission level
Setting the umask for Individual Users
Use the chmod tool to change permissions for an item
Changing Permissions
See the chmod man page for more information
Securing Initial System Accounts
Securing System Accounts
Changing the Owner
Changing the Group
Restricting Use of the sudo Tool
To disable root login
Enter the root password when prompted
Securing the Root Account
Securing Single-User Boot
To set the Open Firmware password for increased security
Setting Password Policy
Computer should restart and display the login window
To set a more secure global password policy
To change a user’s password
To view the global password policy
To set the minimum password length to 5 characters
To query for a user by name
Access the help prompt and enter the command name
Finding User Account Information
See the pwpolicy man page for more information
132
Managing Share Points
Working with File Services
To create a share point
Listing Share Points
Creating a Share Point
To list existing share points
Modifying a Share Point
To change share point settings
Viewing AFP Settings
Managing the AFP Service
Starting and Stopping AFP Service
Checking AFP Service Status
To change several settings
Changing AFP Settings
List of AFP Settings
To change a setting
Location of the error log
Allow an administrator user to masquerade as another user
Authentication mode. Can be
Whether the AFP service should restart automatically when
Default = -1unlimited
Record user logins in the activity log
Login greeting message
Last time the login greeting was set or updated
List of AFP serveradmin Commands
To list connected users
Listing Connected Users
Value returned by getConnectedUsers
To disconnect users
Disconnecting AFP Users
Sending a Message to AFP Users
To send a message
Value Description
Canceling a User Disconnect
To cancel a user disconnect
Computer will repond with the following output
To list service statistic samples
Listing AFP Service Statistics
Computer will respond with the following output
Value displayed by
Viewing AFP Log Files
To view the latest entries in a log
To display the log paths
Viewing NFS Service Settings
Managing the NFS Service
Starting and Stopping NFS Service
Checking NFS Service Status
Checking FTP Service Status
Managing the FTP Service
Starting FTP Service
Stopping FTP Service
List of FTP Service Settings
Changing FTP Service Settings
Parameter ftp Description
Own preferences
Directory in which the FTP content is stored
Displays a banner message that appears when
Prompted to log in to the FTP. Customize to your
Viewing the FTP Transfer Log
List of FTP serveradmin Commands
Checking for Connected FTP Users
Viewing SMB/CIFS Service Settings
Managing the SMB/CIFS Service
Starting and Stopping SMB/CIFS Service
Checking SMB/CIFS Service Status
List of SMB/CIFS Service Settings
Changing SMB/CIFS Service Settings
Parameter smb Description
Medium service start and stop, authentication failures
Browser service. Can be set to
Advanced pane of Windows service settings in the Server
Low errors and warnings only
This corresponds to the Wins Registration Off and Enable
Server’s NetBIOS name. Can be set to a maximum
Pane of the Windows service settings in the Server Admin
Windows service settings in the Server Admin
Listing SMB/CIFS Users
List of SMB/CIFS serveradmin Commands
Computer responds with the following output
Disconnecting SMB/CIFS Users
Listing SMB/CIFS Service Statistics
To list SMB/CIFS connections
Managing ACLs
Viewing SMB/CIFS Service Logs
Location of the SMB service log
Location of the name service log
To deny a guest read permission for a file
Using chmod to Modify ACLs
Following are the permissions applicable to folders
To grant a user write permission for a file
Output should look like the following
To view the ACL of a file
160
Understanding the Print Process
Working with the Print Service
To stop print service
Performing Print Service Tasks
Starting and Stopping Print Service
To start print service
Viewing Print Service Settings
Checking the Status of Print Service
Changing Print Service Settings
Parameter print Description
Print Service Settings
Parameter printDescription
Queue Data Array
Command printcommand= Description
Managing the Print Service
Following is an example of a queue array parameter block
To pause a queue
Pausing a Queue
Listing Queues
Listing Jobs and Job Information
To hold a job
Holding a Job
To release the job
Viewing Cover Pages
Viewing Print Service Log Files
To obtain a list of available cover pages
170
To stop NetBoot service
Understanding the NetBoot Service
Starting and Stopping NetBoot Service
To start NetBoot service
Viewing NetBoot Settings
Checking NetBoot Service Status
Changing NetBoot Settings
Storage Record Array
Changing General Netboot Service Settings
Volume parameter array
Parameter netboot Description
Image Record Array
Filters Record Array
To enable NetBoot
Enabling NetBoot 1.0 for Older NetBoot Clients
Port Record Array
Updating an Image
Booting from an Image
Using hdiutil to Work with System Images
Working with System Images
Imaging Multiple Clients Using Multicast asr
Using asr to Restore System Images
To configure a client to receive a multicast stream
Choosing a Boot Device Using systemsetup
Postfix Agent
Understanding the Mail Service
Mailman
Cyrus
Viewing Mail Service Settings
Managing the Mail Service
Starting and Stopping Mail Service
Checking the Status of Mail Service
Parameter mail Description
Mail Service Settings
Default = +=
Default = 500s
Default = 1s
Default = domain
Default = -=+
Default = 0s
Default = postfix
Default = 1000s
Default = postdrop
Default = flock
Default = flush
Default = 60s
Default = none
Default = 10s
Default = /usr/bin
Default = mail
Default = fcntl
Default = smtp
Default = 7d
Default = qmgr
Default = host
Default = error
Default = showq
Default = 5d
Default = bounce
Default = incoming
Default = active
Default = deferred
Default = 600s
Default = virtual
Default = $home
Default = rewrite
Default = c
Default = 30s
Default = hash
Default = Default
Default = auxprop
Default = cyrus
193
Listing Mail Service Statistics
Mail serveradmin Commands
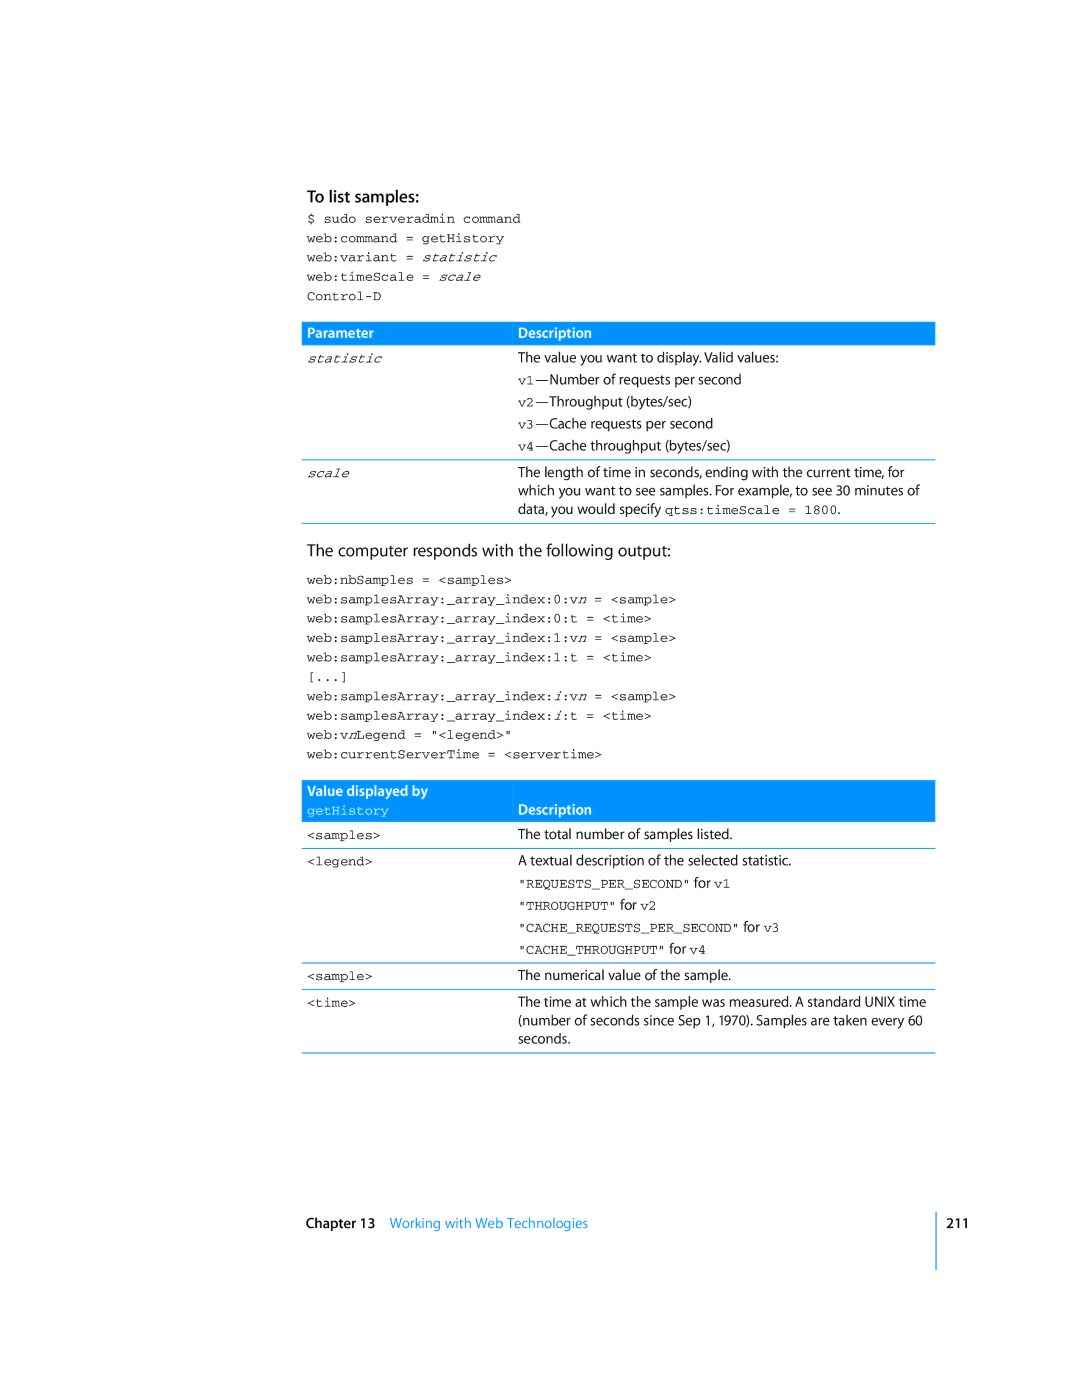
To list samples
Location of the server log
Viewing the Mail Service Logs
Default = srvr.log
To display the log locations
Backing Up the Mail Files
Reconstructing the Mail Database
Generating a CSR and Creating a Keychain
Setting Up SSL for Mail Service
Enter a key size at the next prompt, and then press Return
199
To import an SSL certificate into the keychain
Accessing the Server Certificates
Obtaining an SSL Certificate
Importing an SSL Certificate into the Keychain
To list the certificates stored in the System keychain
Creating a Password File
See the certadmin man page for more information
To create a password file
Enabling Sieve Scripting
Configuring Mailboxes
Sample Sieve Scripts
To enable Sieve support
Reload the mail service
Enabling Sieve Support
Basic Sort and Anti-Junk Mail Filter Script
Self-Defined Forwarding Script
Sieve Scripting Resources
206
Files Location
Understanding Web Technology
Viewing Web Settings
Managing the Web Service
Starting and Stopping Web Service
Checking Web Service Status
Serveradmin and Apache Settings
Changing Web Settings
Changing Settings Using serveradmin
Listing Hosted Sites
Web serveradmin Commands
Viewing Service Logs
Viewing Service Statistics
V3-Cache requests per second
Value you want to display. Valid values
V1-Number of requests per second
V2-Throughput bytes/sec
Addsite File
Example Script for Adding a Website
Addsite.in File
To run the script
Tuning the Server Performance
To start Apache Tomcat
Working with Application Servers and Java
Apache Tomcat
JBoss Server
To stop JBoss, enter the following
To install the default database
MySQL Database
To start JBoss, enter the following
To start mysqld
To set the root password
To create a database
To set the network option
Managing Network Services
Working with Network Services
Viewing Dhcp Service Settings
Managing the Dhcp Service
Starting and Stopping Dhcp Service
Checking the Status of Dhcp Service
To change a single Dhcp setting
Changing Dhcp Service Settings
Dhcp Service Settings
To see a list of available service settings
About Subnet IDs
Dhcp Subnet Settings Array
Subnet Parameter
Lease time in seconds
General pane of the subnet settings in the Server
Not set default
Wins pane of the subnet settings in the Server
Domain name such as apple.com
Corresponds to the NetBIOS Scope ID field in the Wins
Adding a Dhcp Subnet
To add a subnet
To add a static map
Adding a Dhcp Static Map
About Static Map IDs
Determine the location of the Dhcp service logs
List of Dhcp serveradmin Commands
Viewing the Dhcp Service Log
Command Dhcpcommand=Description
Viewing DNS Service Settings
Managing the DNS Service
Starting and Stopping the DNS Service
Checking the Status of DNS Service
Viewing the DNS Service Log
Changing DNS Service Settings
DNS Service Settings
List of DNS serveradmin Commands
Managing the Firewall Service
Configuring IP Forwarding
Firewall Startup
Starting and Stopping Firewall Service
Checking the Status of Firewall Service
Viewing Firewall Service Settings
Firewall Service Settings
Changing Firewall Service Settings
Parameter ipfilter Description
Ipfilter Groups with Rules Array
Defining Firewall Rules
Adding Rules by Modifying ipfw.conf
Unmodified ipfw.conf file
An example of this would be similar to the following
Adding Rules Using serveradmin
Ping cracker.evil.org to determine its IP address
To add a rule
Ipfilter Rules Array
Firewall serveradmin Commands
Location of the ipfilter service log
Managing the NAT Service
Viewing Firewall Service Log
Using Firewall Service to Simulate Network Activity
Changing NAT Service Settings
Starting and Stopping NAT Service
Checking the Status of NAT Service
Viewing NAT Service Settings
NAT serveradmin Commands
NAT Service Settings
Parameter nat Description
Port Mapping
Viewing the NAT Service Log
Viewing VPN Service Settings
Managing the VPN Service
Starting and Stopping VPN Service
Checking the Status of VPN Service
Default = IPSec
Changing VPN Service Settings
List of VPN Service Settings
Default = Keychain
Default = Dsacl
Default = Manual
Default = L2TP
Default = PPP
Default = Mppe
Default = Pptp
Default = EAP-RSA
Restarted. See Using the serveradmin Tool on
List of VPN serveradmin Commands
Viewing the VPN Service Log
VPN Service Log on this
Location of the VPN service log
Configuring Site-to-Site VPN
Site-to-Site VPN
Adding a VPN Keyagent User
Hardware Requirements
Setting Up IP Failover
IP Failover Prerequisites
IP Failover Operation
Enabling IP Failover
To enable IP failover
Notification Only
Configuring IP Failover
Pre and Post Scripts
To restore the NAT service to its default configuration
Restoring the Default Configuration for Server Services
Enabling PPP Dial-In
To restore the DNS service to its default configuration
To restore the Dhcp service to its default configuration
Re-create the two default records
To restore the Qtss service to its default configuration
To restore the VPN service to its default configuration
Testing Your Open Directory Configuration
Using General Directory Tools
Understanding Open Directory
Registering URLs with SLP
Testing Open Directory Plug-ins
Changing Open Directory Service Settings
Modifying a Directory Domain
Managing OpenLDAP
Configuring Ldap
PasswordOptionsString
LDAPTimeoutUnits Default = minutes LDAPServerBackend
Standard Distribution Tools
Configuring slapd and slurpd Daemons
Tool Used to
Searching the Ldap Server
Delay Rebind
Idle Timeout
Idle Rebinding Options
256
257
Using Ldif Files
Managing NetInfo
Configuring NetInfo
Additional Information About Ldap
Enabling or Disabling Authentication Methods
Managing Open Directory Passwords
Open Directory Password Server
Viewing or Changing Password Policies
To load KDC data from a dumped file
Kerberos and Apple Single Sign-On
Backing Up the Kerberos Database
To dump the KDC’s database
To delete a principal
To add a service principal
Principal Management
To add a principal
To kerberize a service from a terminal running on that host
Using Directory Service Tools
Operating on Directory Service Directory Domains
Using kadmin to kerberize a service
Manipulating a Single Named Group Record
Finding Network Information
To remove an Ldap server
Adding or Removing Ldap Server Configurations
Configuring the Active Directory Plug-In
To add an Ldap server
266
Understanding QuickTime Streaming Server
Performing Qtss Service Tasks
Changing Qtss Settings
Starting and Stopping the Qtss Service
Checking Qtss Service Status
Viewing Qtss Settings
Look in the sample file for
Qtss Settings
Descriptions of Settings
Default = qtaccess
Default = admin
Default = digest
Logs on
Default = qtss
Managing Qtss
Listing Current Connections
For connections v1, this is integer average number
Viewing Qtss Service Statistics
Connections
List the Qtss processes
Send a HUP signal to this process
Forcing Qtss to Reread its Preferences
To force Qtss to reread its preferences
To reset the user name and password
Configuring Streaming Security
Resetting the Streaming Server Admin User Name and Password
To set up Sites/Streaming/ in older home folders
Creating an Access File
Controlling Access to Streamed Media
Qtusers
Between terms, make sure you enclose the entire message
Quotation marks
Path and filename of the user file
Making Changes to the User or Group File
Accessing Protected Media
Adding User Accounts and Passwords
Adding or Deleting Groups
Create XML text ref movie with extension .qtl
Manipulating QuickTime and MP4 Movies
Creating Reference Movies
Create QuickTime Atom ref movie with extension .qtl
280
Configuring Your System Logging
Configuring the Log File
Local Logging
Remote Logging
Configuring Remote Logging on a Client Computer
To enable remote logging on a client computer
Configuring Remote Logging on a Server
Open /etc/rc and locate the following line
Or match a single host like this
PCI RAID Card Command Reference
286
287
288
Computer account See computer list
Glossary
Directory node See directory domain
Full name See long name
292
293
294
Relay point See open relay
Search path See search policy
297
298
Restoring images Logs Lpr Backup Cyrus Mail files
Access
Securing Chgrp tool ACL access control list
136 Example Stopping service Naming 41
Disk journaling
Dynamic Host Configuration Protocol. See Dhcp
Error messages command not found Executing commands
Image Booting from 176 updating
Backing up Principal management 262 tools and utilities
Kerberosautoconfig tool 261 keychain
QuickTime Streaming Server. See Qtss
302
AFP DNS
Used by ldapsearch 255 scheduling tasks
Tools for remote configuration
239 Terminating commands
Time, viewing or changing 57 Stopping service
Viewing service logs