
KF730P specifications
The EAW KF730P is a state-of-the-art loudspeaker system that is particularly designed for live sound reinforcement, providing exceptional audio quality and performance for a variety of applications. With a focus on versatility and powerful output, the KF730P is an ideal choice for concert venues, festivals, corporate events, and touring musicians.One of the primary features of the KF730P is its advanced array design. The loudspeaker employs a unique 3-way configuration that includes a high-frequency compression driver, a mid-frequency driver, and dual low-frequency drivers. This allows for a wide frequency response, ensuring that both the high and low ends of the audio spectrum are rendered with clarity and precision. This multi-driver setup ensures that the KF730P can handle a range of musical genres, from classical to rock, without compromising sound quality.
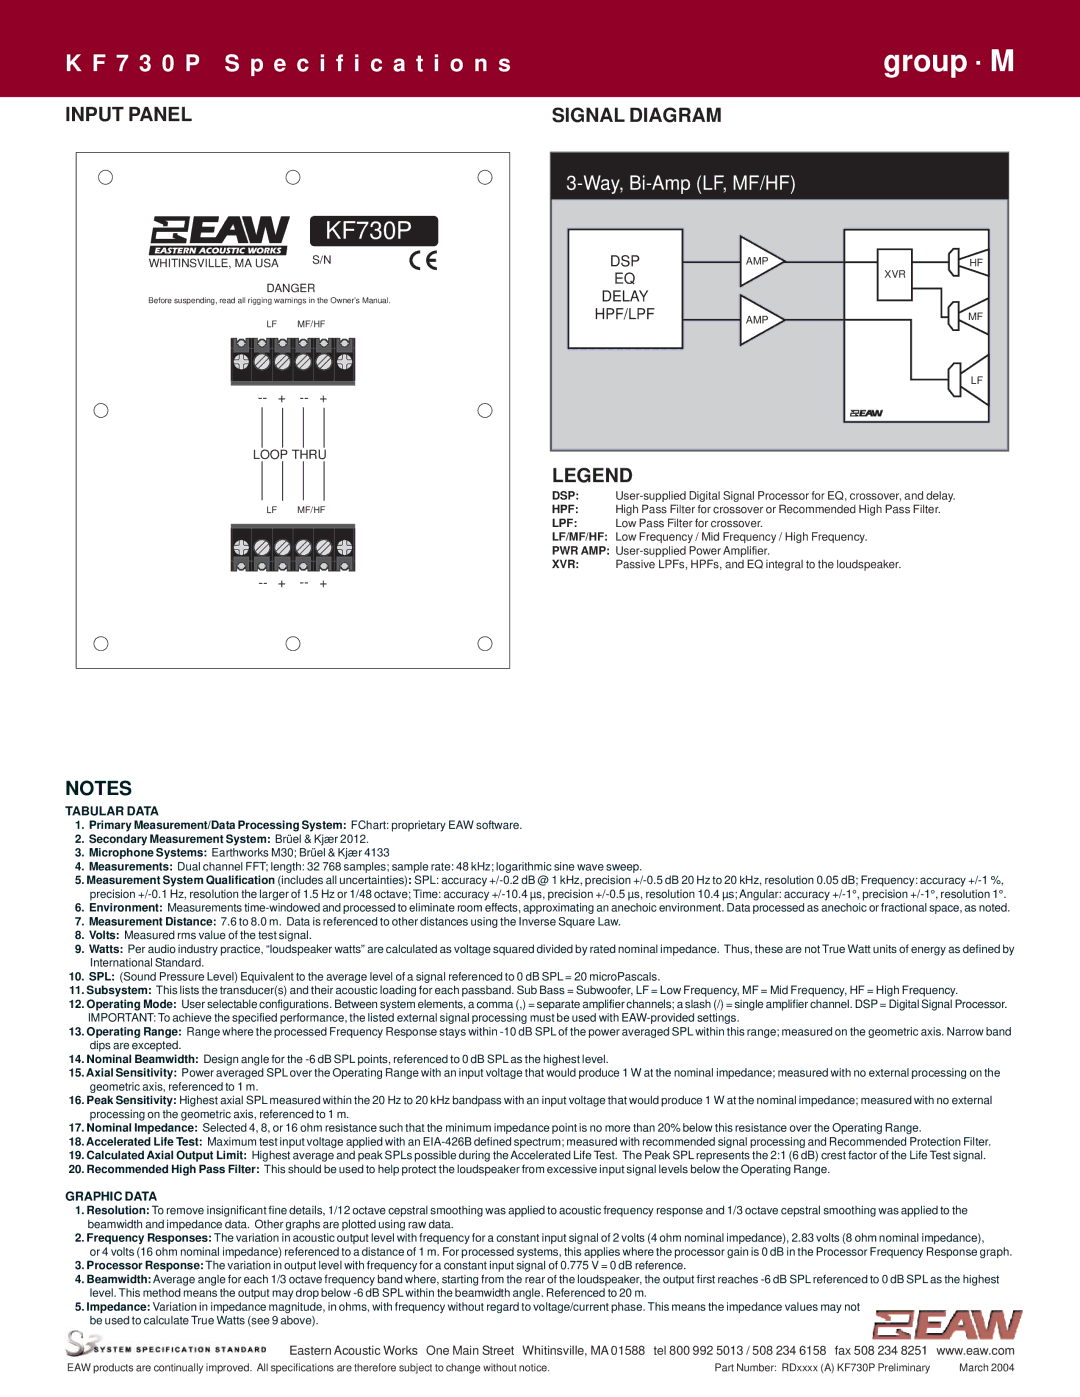
The KF730P is equipped with the latest digital signal processing (DSP) technology that enhances its performance in live settings. This includes features such as FIR (Finite Impulse Response) filtering, which optimizes phase coherence and frequency response, resulting in an even sound distribution across the coverage area. Furthermore, the integrated DSP offers the ability to customize the sound profile based on the specific needs of a venue or event, providing sound engineers with unparalleled control.
Another noteworthy characteristic of the KF730P is its robust construction. Built with high-quality materials, the loudspeaker is designed to withstand the rigors of touring and live performances. Its lightweight yet durable cabinet is resistant to wear and tear, making it a reliable option for both permanent installations and mobile use. Additionally, the enclosure design minimizes resonance and vibration, further enhancing overall sound fidelity.
Portability is also a key aspect of the KF730P. The system is designed with user-friendly features such as integrated rigging points, which facilitate easy and safe deployment in flying configurations. This ensures that the loudspeaker can be quickly set up and taken down, allowing for efficient operation during fast-paced events.
In summary, the EAW KF730P is a top-tier loudspeaker system that combines advanced technology, high-quality build, and versatile applications. With its impressive sound capabilities and ease of use, it stands out as an essential tool for audio professionals looking to deliver outstanding sound experiences in any environment.