|
|
|
|
|
| 50k | ||||||
|
|
|
|
|
|
| 0 |
|
|
|
|
|
|
|
|
| 0.0 |
|
|
|
| ||||
| Fish | 20 |
|
|
|
|
| |||||
|
|
|
|
|
| |||||||
|
|
|
|
|
| |||||||
|
|
|
|
|
| |||||||
|
|
|
|
|
| |||||||
|
|
|
|
| ||||||||
| school | 40 |
|
|
|
|
| |||||
|
|
|
|
|
|
|
|
|
|
| ||
|
|
|
|
|
|
|
|
|
|
| ||
|
|
|
|
|
|
|
|
|
|
| ||
|
|
|
|
|
|
|
|
|
|
| ||
|
|
|
|
|
|
|
|
|
|
| ||
|
|
|
|
|
|
|
|
|
|
|
|
|
|
|
|
|
|
|
|
|
|
|
|
|
|
|
|
|
|
|
|
|
|
|
|
|
|
|
|
|
|
|
|
|
|
|
|
|
|
|
|
|
|
|
|
|
|
|
|
|
|
|
|
|
Bottom
60![]()
![]()
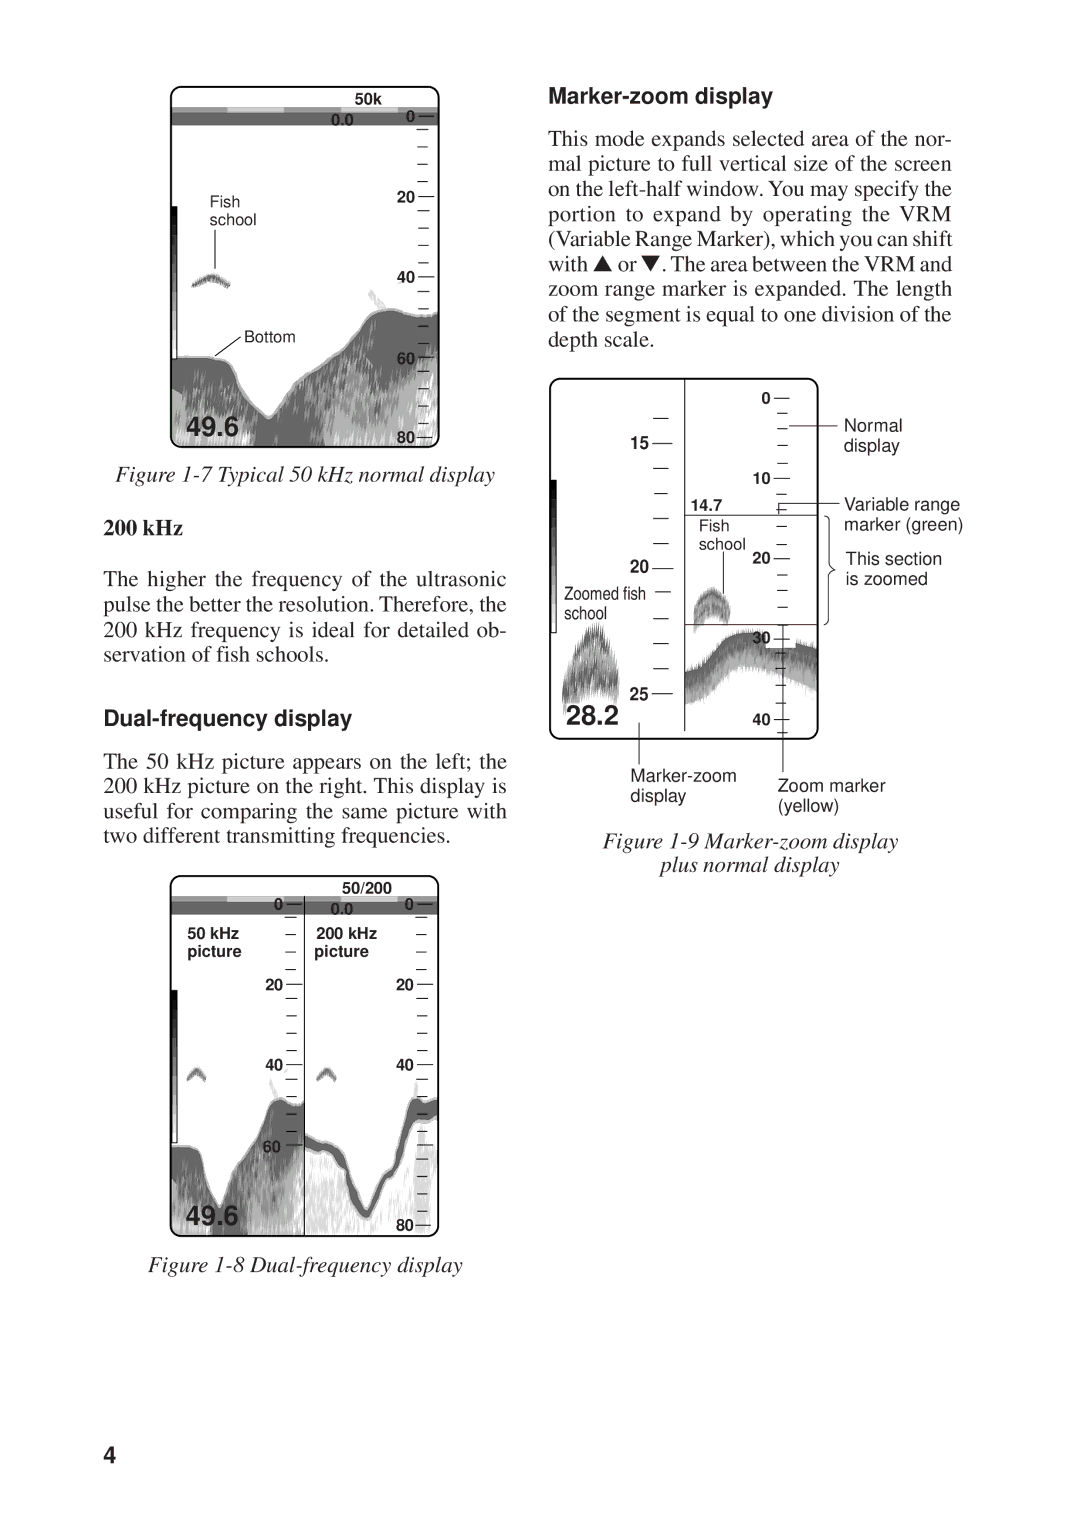
Marker-zoom display
This mode expands selected area of the nor- mal picture to full vertical size of the screen on the
 49.6
49.6


 80
80

Figure 1-7 Typical 50 kHz normal display
200 kHz
The higher the frequency of the ultrasonic pulse the better the resolution. Therefore, the 200 kHz frequency is ideal for detailed ob- servation of fish schools.
Dual-frequency display
15
20
Zoomed fish school
25
28.2
0 |
10 |
14.7 |
Fish |
school |
20 |
30 |
40 |
Normal display
Variable range marker (green)
This section is zoomed
The 50 kHz picture appears on the left; the
200 kHz picture on the right. This display is useful for comparing the same picture with
display
Zoom marker (yellow)
two different transmitting frequencies.
0 | 50/200 | 0 |
0.0 | ||
50 kHz | 200 kHz |
|
picture | picture |
|
20 |
| 20 |
40 |
| 40 |
60 |
|
|
49.6 |
| 80 |
Figure 1-8 Dual-frequency display
Figure 1-9 Marker-zoom display
plus normal display
4