Viewing the Pressure, Temperature and Humidity Bar Charts
The pressure bar graph shows barometric pressure variations over the past 24 hours. This is very useful for understanding the Barometric trends that are used in weather forecasting. Each bar icon represents 0.06 inHg.
Alternatively, the bar chart can be used to display 24 hour trend data for Sea Level Pressure, CH 1 Remote temperature or Ch1 Remote humidity.
Select the Pressure and Weather Forecast window, press and hold ALARM/CHART button to toggle the bar chart title at the right bottom corner of the chart. Alternate between “PRESSURE”, “CH1”temperature (thermometer icon) and “CH1” relative humidity (dew drop icon)
Viewing the Moon Phase History
The unit indicates the current moon phase and using the MEMORY button will permit viewing of the past or future days. Previous moon phases are selected with the minus sign selected:
∙After selecting the Pressure and Weather Forecast display, press MEMORY button, so “+ 0 days” is flashing.
∙Press UP or DOWN arrow buttons selecting from today’s date a future (+) or past
∙To exit, press MEMORY button.
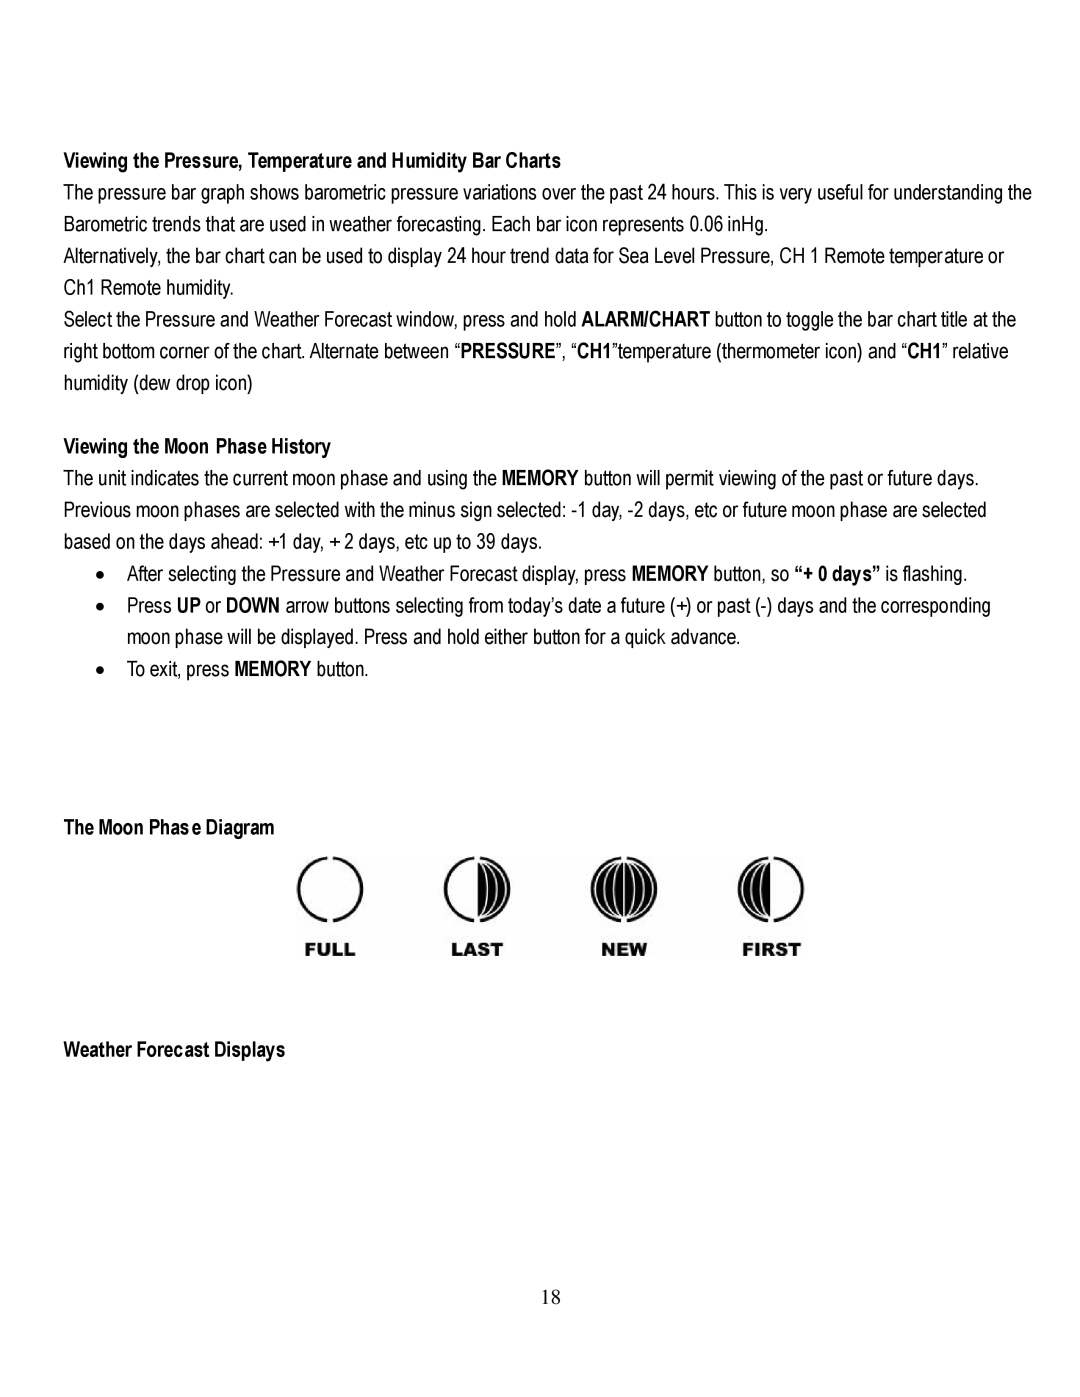
The Moon Phas e Diagram
Weather Forecast Displays
18