Matrix 67GPS Trackplotter Operations Manual
Thank You
Table of Contents
Sonar X-Press Menu Sonar Views Only
Navigation X-Press Menu Navigation Views Only
Sonar Menu Tab
Alarms Menu Tab
Setup Menu Tab
Navigation Menu Tab
Accessories Menu Tab Troubleshooting
How Sonar Works
DualBeam Plus Sonar
QuadraBeam Sonar
WideSide Sonar
How GPS and Cartography Work
With Optional-Purchase WideSide Transducer
Detailed Map
Multi-Media Card MMC
Bait Ball Hard Bottom Rocky Bottom
What’s On the Sonar Display
To your boat, including the following items
83 kHz, Wide Beam Hollow Fish Symbol
Zoom View
Views
Sonar views
Sonar View
Sonar View
Sonar View
Real Time Sonar RTS Window
Understanding Sonar History
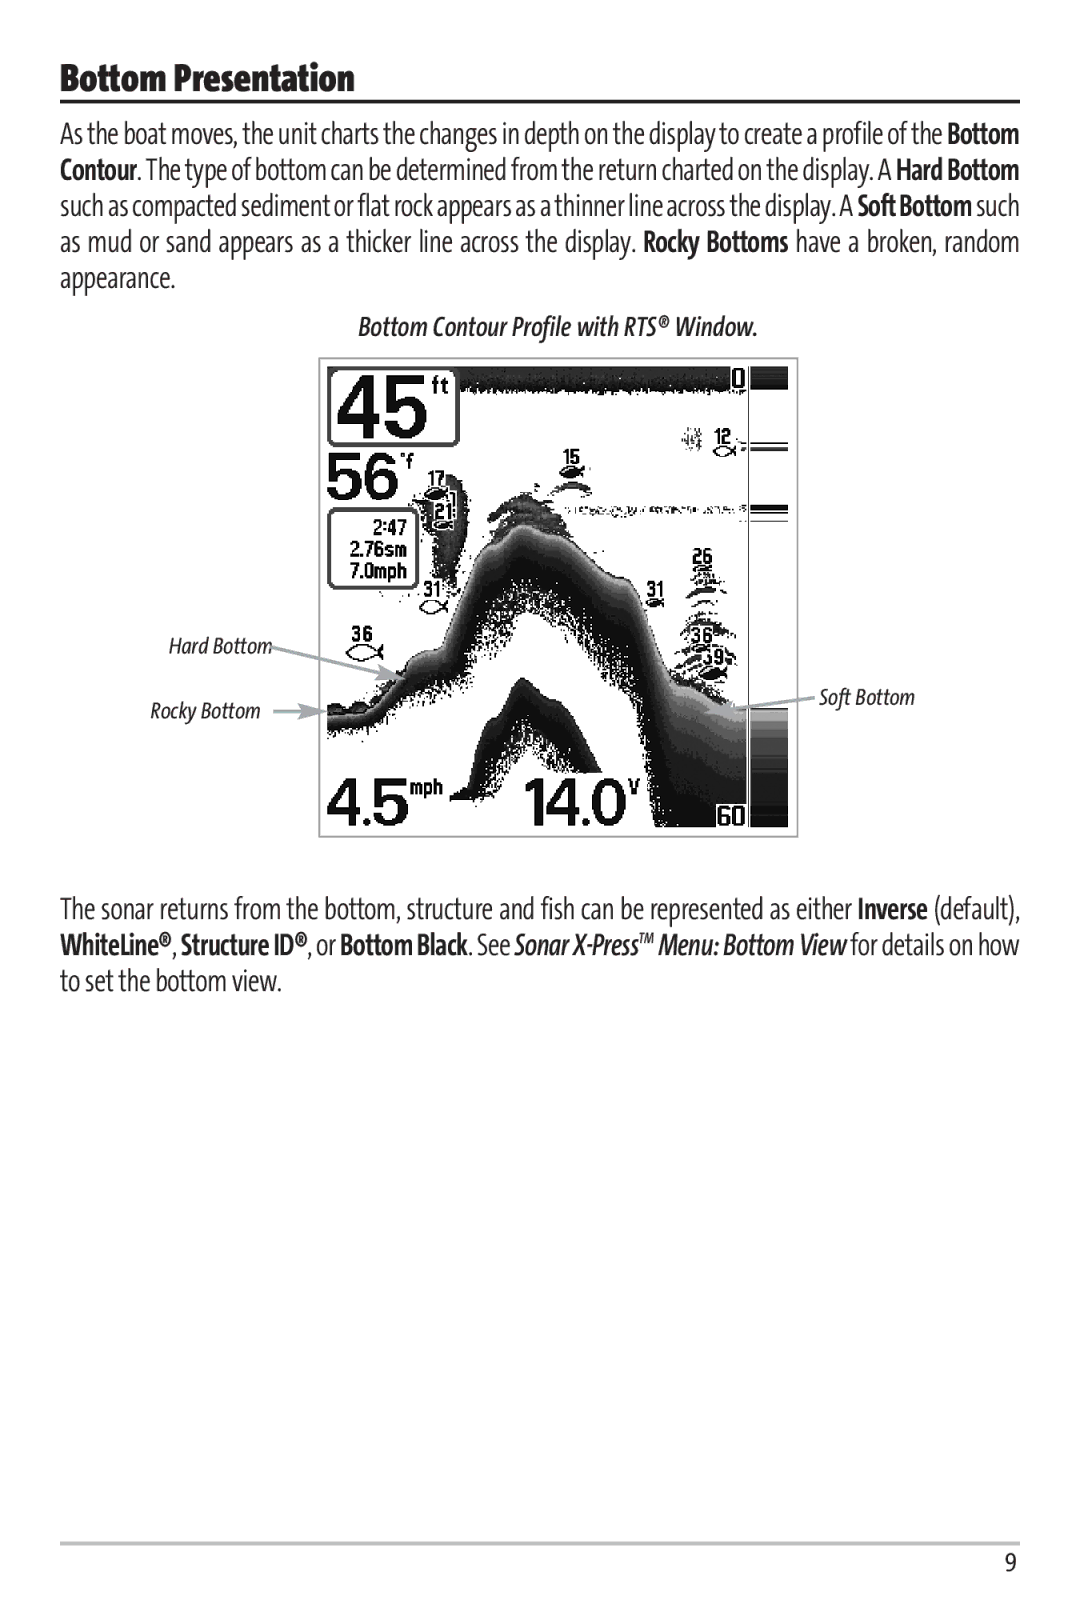
Bottom Contour Profile with RTS Window
Bottom Presentation
Page
Sonar Zoom View
Sonar Zoom View
Big Digits View
200/83 kHz Split Sonar View
Big Digits View
200/83 kHz Split Sonar View
Side Beam View
Side Beam View
WideSide View
WideSide View
Bird’s Eye View
Bird’s Eye View
Chart View with Active Cursor
Chart View
Combo View
Combo View
View Orientation
Viewing Cartography
Page
Introduction to Navigation
Waypoints, Routes and Tracks
Waypoints, Routes and Tracks
Save, Edit, or Delete a Waypoint
Navigate to a Waypoint or Position
Add a Waypoint Target or Trolling Grid
Chart View with Grid
Save, Edit or Delete a Route
Edit, Delete or Hide Saved Tracks
Save or Clear a Current Track
Info Key
POWER/LIGHT Key
Key Functions
View Key
Menu Key
WAY Cursor Control Key
Mark Key
Goto Key
Zoom +/- Key
Exit Key
Accessory Bus
Powering Up the Unit
Matrix 67 Title Screen
Menu System
Main Menu System Normal User Mode
Sonar Tab, Normal Mode Sonar Tab, Advanced Mode
Start-Up Options Menu
Normal Operation
Simulator
System Status Self Test Screen
Self Test Accessory Test GPS Diagnostic View
Accessory Test Screen
System Status
GPS Diagnostic View
PC Connect
With PC Connect Cable Only
Sonar X-PressTMMenu
To adjust the WideSide View
Sonar X-PressTMMenu
Sonar Views Only
Sensitivity at Low Sensitivity at Medium
To adjust the Sensitivity
Sensitivity
Highlight Sensitivity on the Sonar X-PressTMmenu
Upper Range
To adjust the Upper Range
To adjust the Lower Range
Lower Range
Highlight Lower Range on the Sonar X-PressTMmenu
Highlight Chart Speed on the Sonar X-Press menu
Chart Speed
To adjust the Side Beam Range
To adjust the Chart Speed
Zoom Level
To adjust the Bottom View
To adjust the Zoom Level
Bottom View
Navigation X-PressTMMenu
Save Current Track
Clear Current Track
Cancel Navigation
Save Current Route
Skip Next Waypoint
Remove Target
Remove Grid
Sonar Window
Sonar Menu
Sonar Menu Tab
Beam Select
To use Beam Select
Highlight Beam Select on the Sonar main menu
Fish ID+TM
To turn Fish ID+TM on or off
Transducer Cone and Fish Arches
KHz Sensitivity
Fish Sensitivity
WideSide Sensitivity
KHz Balance
To change the Depth Lines setting
Depth Lines
Depth Lines
To change the Surface Clutter setting
Surface Clutter
Surface Clutter
Max Depth
To change the Noise Filter setting
To change the Max Depth setting
Noise Filter
To change the selected Transducer
To change the Water Type setting
Water Type
Transducer Select
Navigation Menu Tab
Highlight Tracks on the Navigation main menu
Tracks
Tracks allows you to view the Tracks submenu
To view the Tracks Submenu
Waypoints Submenu contains the following menu choices
Waypoints
To view the Waypoints Submenu
Highlight Waypoints on the Navigation main menu
Routes Submenu contains the following menu choices
To change the View Orientation setting
Routes
To view the Routes Submenu
Map Borders
Chart Detail Level
To change the Chart Detail Level setting
To change the Map Borders setting
Grid Rotation
Lat/Lon Grid
Spot Soundings
North Reference
Track Min Distance
To change the Trackpoint Interval setting
To change the Track Minimum Distance setting
Trackpoint Interval
Map Datum
Set Simulation Position
Set Map Offset
To Delete All Navigation Data
Clear Map Offset
Delete All Nav Data
To Clear Map Offset
Alarms Menu Tab
From any view, press the Menu key twice to access the Main
Alarms Menu
To change the Fish ID Alarm setting
Depth Alarm
Fish ID Alarm
To change the Depth Alarm setting
Highlight Low Battery Alarm on the Alarms main menu
Low Battery Alarm
Off Course Alarm
To change the Low Battery Alarm setting
Arrival Alarm
Drift Alarm
Alarm Tone
Setup Menu Tab
Setup Menu Tab
Units Depth
Units Temp
Units Distance
User Mode
Units Speed
Language
To Restore Defaults
Triplog Reset
Restore Defaults
To Reset Triplog
Select Views
To Select Views
Select Views
Select Readouts
Advanced, Sonar View Only
To Select Readouts
Depth Offset
Temp Offset
Speed Calibration
Local Time Zone
Daylight Savings Time
Position Format
To change the Time Format
Time Format
Date Format
Advanced, International Only
To turn Nmea Output on or off
Nmea Output
Sonar
Following Nmea sentences are output
Accessories Menu Tab
Accessories Menu Tab
Fishing System Doesn’t Power Up
Troubleshooting
Problem Possible Cause
Display Problems
Possible Source of Noise Isolation
Finding the Cause of Noise
Matrix Fishing System Accessories
Specifications
Page
Monday Friday 800 a.m. to 430 p.m. Central Standard Time
Custserv@techsonic.com