User Guide
Page
User Guide
Copyright IBM Corporation 1999
Contents
Iv Sterling ConnectDirect for Unix User Guide
Starting the CLI
Overview of the Command Line Interface
CLI Commands
Stopping the CLI
Sample Command
Option Description Value Entry
CLI Job Control
Cdpnum
Command
CLI History Commands
Overview of Sterling ConnectDirect Commands
Command Abbreviation Description
Abbreviations for Common Sterling ConnectDirect Commands
Parameter Abbreviation
Submitting a Process
Pname = A?PROD5
Parameter Description Values
Parameter Description Values
Username@hostname or user@localhost
Id , pswd
Name host name nnn.nnn.nnn.nnn or
Name nnnnn
Id ,pswd ,newpswd
Snodeid field
Specify retain=initial
Following command submits the Process named payroll
Following command submits the Process named copyfil
Parameter Description Value
Following command submits the Process named copy.cdp
Changing Process Parameters
Name generic list
Remote node specification generic list
Node specification, userid generic list
Deleting a Process from the TCQ
Number list
Removing a Process from the Execution Queue
Flush process command has the following optional parameters
Stopping Sterling ConnectDirect
Viewing a Process in the TCQ
Parameter Description
Pname Locate the Process to view
EX HC HE HI HO HR HS PE
Following command displays the specified Process number
Monitoring Process Status in the TCQ
All
EX HC HE HI HO HR HS PE
Output from the command is displayed in the following table
Determining the Outcome of a Process
Dest=/path/file name
Caev Capr CAEV, Capr
Record id list
Parameter Description Value
Parameter Description Value
Parameter Description Value
Srcf=/path/file name
Date day , hhmmss ampm
Generating a Detailed Output Report for a Process
Select Statistics
Running System Diagnostics
Generating a Summary Report for a Process
Recid LOG Timepname Pnumber Stepname Ccod Fdbk Msgid
COMM.TRC
Smgr
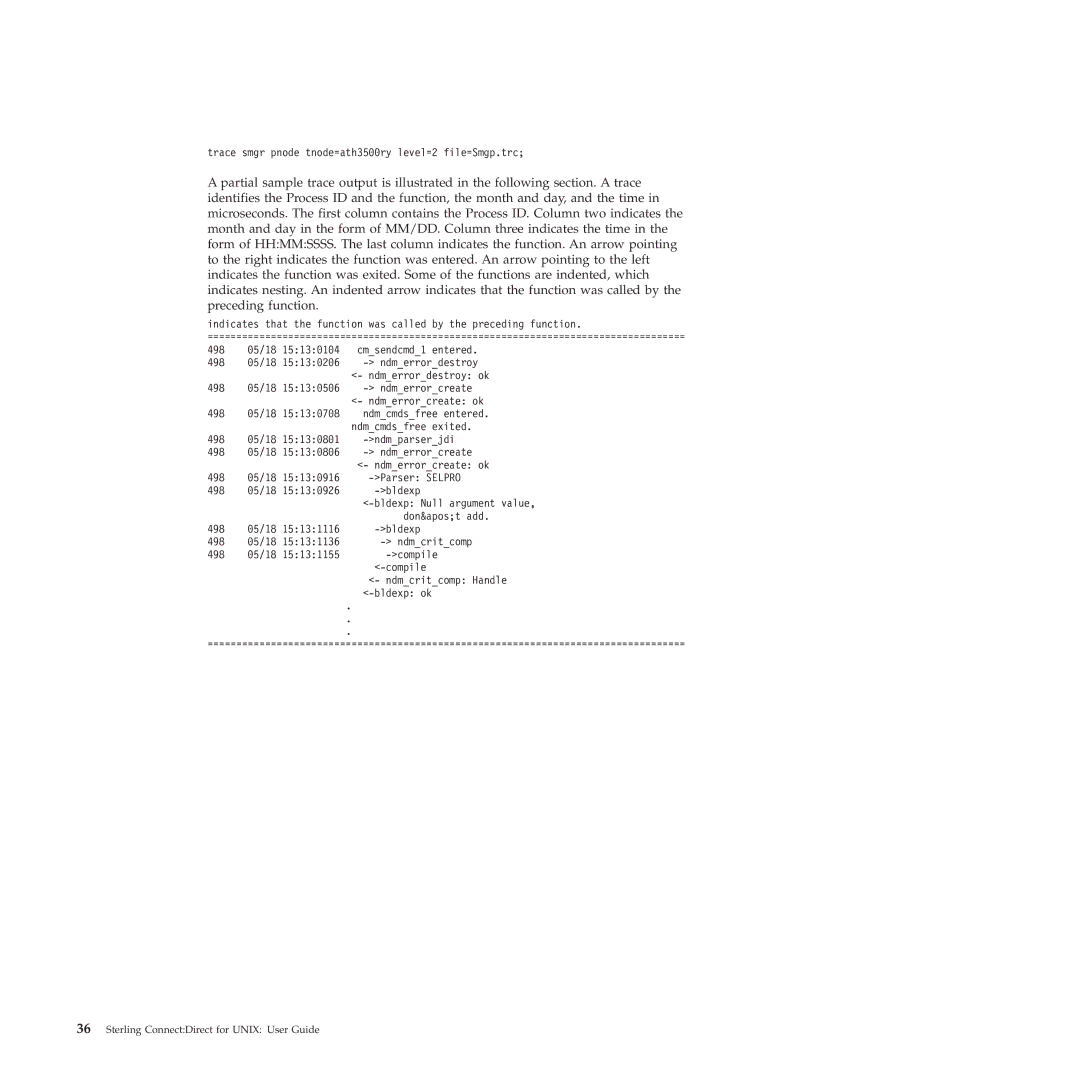
Trace smgr pnode tnode=ath3500ry level=2 file=Smgp.trc
Scheduling Sterling ConnectDirect Activity
Command Definition
Overview of the Transmission Control Queue
Scheduling Parameter Queue Comments
Progression of a Process Through the TCQ
Execution Queue
Wait Queue
Element Comment
Status Comment
Timer Queue
Hold Queue
Held for Call indicates that the Process was
Introduction to Translation Tables
Creating a Translation Table
Compiling a Translation Table Using the ndmxlt Utility
Example-Creating a Translation Table
Using Translation During File Transfer Operations
Example-Modifying a Model Translation Table
Message File Content
Translation Table Error Messages
Accessing Sterling ConnectDirect Messages
Diagnostic Number Description
Displaying Message Text
Following is a sample ndmmsg command
Message File Record Format
Following are the parameters for the message file record
Sterling ConnectDirect for Unix User Guide
Level-Compression level
Using the Standalone Batch Compression Utility
Following are the parameters for the cdsacomp utility
Memory-The amount
Source codepage, destination
Codepage
Nnnnn
Example-Precompress a Binary File
Example-Precompress a Text File
Example-Precompress a Text File With Codepage Conversion
Example-Decompress a Text File
Examples-csdacomp Command Help
Cfgcheck command has the following arguments
Validate Configuration Files
Configuration Reports
Argument Description
Generating a Configuration Report on the Base Installation
Type the following command at a Unix prompt
Sterling ConnectDirect Utilities
Following example shows an excerpt from a sample report
Sterling ConnectDirect Utilities
Sterling ConnectDirect for Unix User Guide
Compiling Custom Programs
Program using the C++ API calls
Introduction to Writing Custom Programs
Compiler version to use for each platform
Platform Compile Command
You want to create such as apicheck
Writing Custom C Programs
++ Function Description
Ndmerrenth
Ndmnoerror
Ndmerror
Receiving Responses Using ndmapirecvresp or ndmapirecvrespc
Ndmapirecvresp or
Ndmapirecvrespc
Parameter Description Value
PNOD-PNODE
Return Code Description
Following is a sample ndmapirecvresp function
SNOD-SNODE
Truncated
Ndmapirecvresp or ndmapirecvrespc to retrieve
Following is a sample ndmapisendcmd function
Writing Custom C++ Programs
Ndmapisendcmdc function call has the following return codes
Selectstatistics or Selectprocess , the CLI
Sterling ConnectDirect for Unix User Guide
Method Description Parameter Return Values
Cdfailure
Following is the ConnectDirectSession class header
Cdsuccess = 0, Cdfailure =
Writing Custom Programs
Sterling ConnectDirect for Unix User Guide
Program Description
User Exit Programs
User Exit Functions
Chown root exitskeleton
Goodrc Errorrc
Return Code
Waiting for a Message Using recvexitmsg or recvexitmsgc
Exitprogram
Following are the parameters for sendexitmsg or sendexitmsgc
Header
Overview of User Exit Messages
Statistics Exit Message
File Open Exit Messages
Security Exit Messages
Fileopenoutputreplymsg
Generatemsg
Validatemsg Validatereplymsg
User Exit Stop Message
Copy Control Block
Exit Log Files
Copyright IBM Corp
IBM Corporation J46A/G4 Bailey Avenue San Jose, CA
Trademarks
Sterling ConnectDirect for Unix User Guide
Index Special characters
Generatemsg Generatereplymsg Validatemsg Validatereplymsg
Page
Sterling ConnectDirect for Unix User Guide
Page
Product Number 5725-C99
