will not mistake the new location as being a possible change in
WEATHER TENDENCY INDICATOR
Working together with the weather icons is the weather tendency indicators (located on the left and right sides of the weather icons). When the indicator points upwards, it means that the
Taking this into account, one can see how the weather has changed and is expected to change. For example, if the indicator is pointing downwards together with cloud and sun icons, then the last noticeable change in the weather was when it was sunny (the sun icon only). Therefore, the next change in the weather will be cloud with rain icons since the indicator is pointing downwards.
Note:
Once the weather tendency indicator has registered a change in air pressure, it will remain permanently visualized on the LCD.
AIR PRESSURE HISTORY (ELECTRONIC BAROMETER WITH BAROMETRIC PRESSURE TREND)
The bottom section of the LCD also shows the relative air pressure value and the air pressure history.
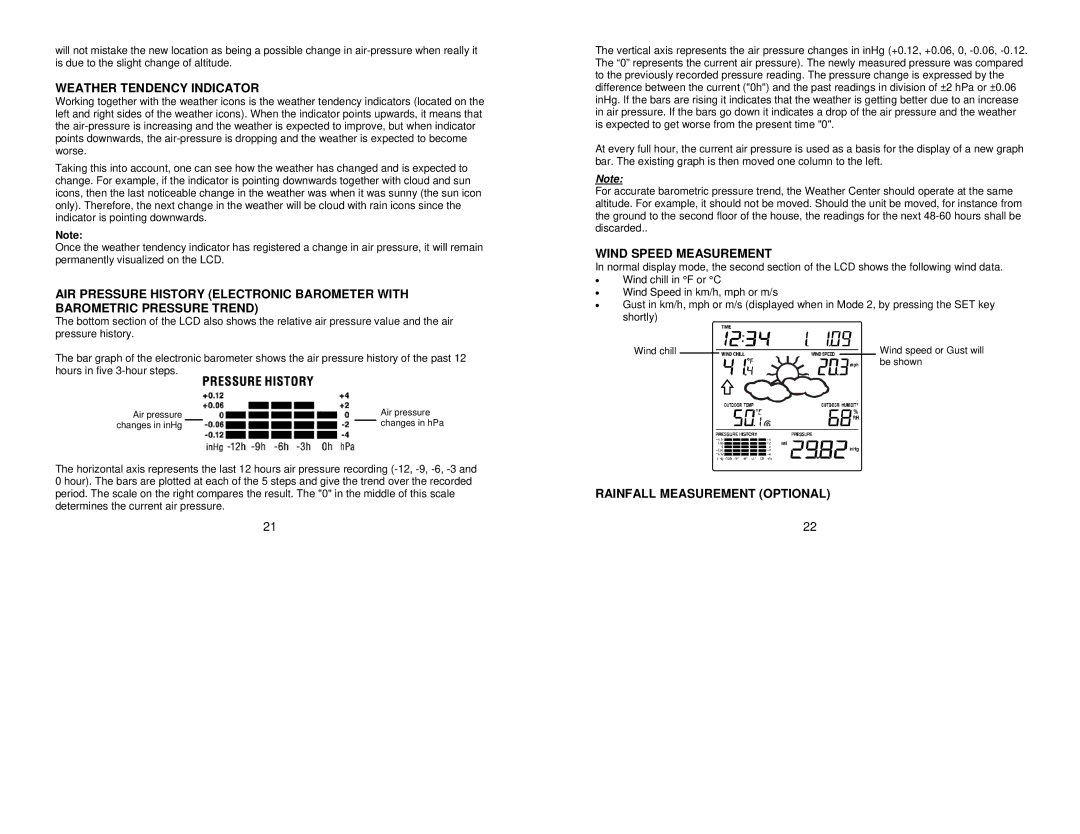
The bar graph of the electronic barometer shows the air pressure history of the past 12 hours in five
Air pressure |
| Air pressure | ||
changes in inHg |
|
|
| changes in hPa |
The horizontal axis represents the last 12 hours air pressure recording
21
The vertical axis represents the air pressure changes in inHg (+0.12, +0.06, 0,
At every full hour, the current air pressure is used as a basis for the display of a new graph bar. The existing graph is then moved one column to the left.
Note:
For accurate barometric pressure trend, the Weather Center should operate at the same altitude. For example, it should not be moved. Should the unit be moved, for instance from the ground to the second floor of the house, the readings for the next
WIND SPEED MEASUREMENT
In normal display mode, the second section of the LCD shows the following wind data.
∙Wind chill in °F or °C
∙Wind Speed in km/h, mph or m/s
∙Gust in km/h, mph or m/s (displayed when in Mode 2, by pressing the SET key shortly)
Wind chill |
|
|
|
|
|
|
|
|
|
| Wind speed or Gust will |
|
|
|
|
|
|
|
|
|
| ||
|
|
|
|
|
|
|
|
|
| ||
|
|
|
|
|
|
|
|
|
|
| be shown |
|
|
|
|
|
|
|
|
|
|
| |
|
|
|
|
|
|
|
|
|
|
|
|
|
|
|
|
|
|
|
|
|
|
|
|
|
|
|
|
|
|
|
|
|
|
|
|
|
|
|
|
|
|
|
|
|
|
|
|
|
|
|
|
|
|
|
|
|
|
|
|
|
|
|
|
|
|
|
|
|
|
|
|
|
|
|
|
|
|
|
|
|
|
|
|
RAINFALL MEASUREMENT (OPTIONAL)
22