Gigastor
Page
GigaStor User Guide
Trademark Notices
Limited Warranty-Software
Ownership and Confidentiality
Technical Support
Rev
Contents
Packet Capture or GigaStor Capture
What is a probe instance?
Using the Observer console locally on the GigaStor
GigaStor GigaStor Expandable Controller unit Expansion unit
Rev
About the GigaStor
GigaStor versions
GigaStor models
GigaStor versions
GigaStor versions About the GigaStor
Installing Your GigaStor
Unpacking and inspecting the parts
Installing the GigaStor and connecting the cables
Setting the GigaStor’s IP address
Default TCP/IP settings
Probe Service Configuration Applet
Connecting Observer to the GigaStor
Redirecting the GigaStor probe
Edit Remote Probe Entry
Probe administration
Probe Instance Redirection
Remote Probe Administration
Edit Probe Instance Capture Buffer Memory
GigaStor Instances
Edit Probe Instance Configure Memory
GigaStor Capture Analysis
GigaStor Control Panel
GigaStor Settings Schedule tab
Configuring Observer for your Gigabit device
Jumbo Frame Support Gigabit Ethernet
Configuring Terms of Service and Quality of Service settings
Configuring Observer for your WAN device
ToS/QoS tab
Digital DS3/E3/HSSI Probe Settings
Projects on the link
Digital T1/E1 Probe Settings
Thermometer
Serial T1/E1 Probe Settings
Serial T1/E1 probe settings
Tapping an Ethernet or Fibre Channel connection
10/100/1000, 10GbE Optical, and Fibre Channel
Gen2 card port assignments
GigaStor with an optical nTAP
Gigabit copper
Port Gen2 card port assignments
GigaStor with a copper TAP
Tapping a WAN connection
T1/E1
Digital T1/E1 Tap
Serial
WAN Serial T1/E1 TAP
DS3/E3
DS3/E3 TAP
Serial/HSSI
WAN Hssi
Installing the drives in your GigaStor
GigaStor drive locations
Connecting the GigaStor Expandable to the expansion units
Cable diagram for the GigaStor Expandable
Packet Capture or GigaStor Capture
Capturing Packets with the GigaStor
Packet capture buffer and statistics buffer
You want a buffer that will handle your largest, worst case
Rev
GigaStor Control Panel
GigaStor Control Panel
Display Controls
Chart right-click menu
Right-click menus
Analyze button
GigaStor Control Panel Analyze button
GigaStor Analysis Filter
Processing for features you are not interested
Compatible feature
Otherwise leave it unchecked
Configuring the GigaStor through the Control Panel
GigaStor Options tab
GigaStor Options tab
Memory, and disk storage consumption
Administration dialog
Capture Buffer size
Links or networks, you can decrease the capture buffer size
GigaStor Control Panel Charts and statistical displays
Wireless Channel Change
Specify a Fixed Sampling Ratio to consider when updating
Start/Stop Packet Capture marker
GigaStor Chart tab
GigaStor Outline
GigaStor Outline
Dropdown
Allows you to select which item will be configured
Capture Graph tab
Item line thickness
GigaStor Schedule tab
Schedule tab
Statistics Lists tab
Adding, Modifying, and Deleting Time Intervals
Subnet
Statistics Lists tab
GigaStor Subnet tab
Subnet and IP Stations
GigaStor reports
GigaStor Reports tab
Report Setup
Export
Exports tab
Rev
Using Observer with a WAN Probe
Setting the Committed Information Rate CIR for a Dlci
Discover Network Names
Edit Dcli
WAN Bandwidth Utilization
WAN bandwidth utilization
WAN Vital Signs by Dlci
WAN Vital Signs by Dlci pane
Though it is still labeled Dlci
WAN Load by Dlci
DCE KBits/s Max DTE KBits/s Max
WAN Load by Dlci
WAN Top Talkers
WAN Load by Dlci Graph View
WAN Filtering
TIP
Triggers and Alarms
Active Filters
Probe Alarm Settings
Triggers and Alarms Using Observer with a WAN Probe
Forensic Analysis using Snort
Starting Forensic Analysis using Snort rules
Select Forensic Analysis Profile dialog
GigaStor Analysis Options Forensic Analysis section
Forensic Settings
Forensic Settings
Rules tab
About Forensic Analysis tab
Forensic Summary
About the Forensic Analysis Log tab
Forensic Analysis Log tab
Forensic Analysis Profile Settings tab
Forensic Analysis Profile field descriptions
IP Flow
Settings Profile
Settings, and share them with other Observer consoles
Considered active
FieldDescription
103
Forensic Analysis Profile Settings tab
Traffic resulting from these types of attacks
Template when changing values of address and port variables
ARP Inspection
Forensic Summary Window
Rules tab
Observer on the GigaStor
Using the Observer console locally on the GigaStor
Expert Probe interface
TIP! Switching Back to Expert Probe
Probe Instances
What is a probe instance?
Active probe instance compared to passive
TIP! Active Probe Instance Best Practices
RAID
Gen2 Capture Card
Configuring virtual adapters on the Gen2 card
Swapping the Gen2 card’s SFP or XFP interfaces
GigaStor probe
Assign Port to Virtual Adapter Default view
Edit Port Description
Make Instance Active
Computer Management window
Rev
TCP/IP ports, NAT, and VPN
TCP/IP ports
NAT
VPN
126 VPN Appendix a TCP/IP ports, NAT, and VPN
GigaStor, GigaStor Expandable, Expansion Unit Cases
GigaStor
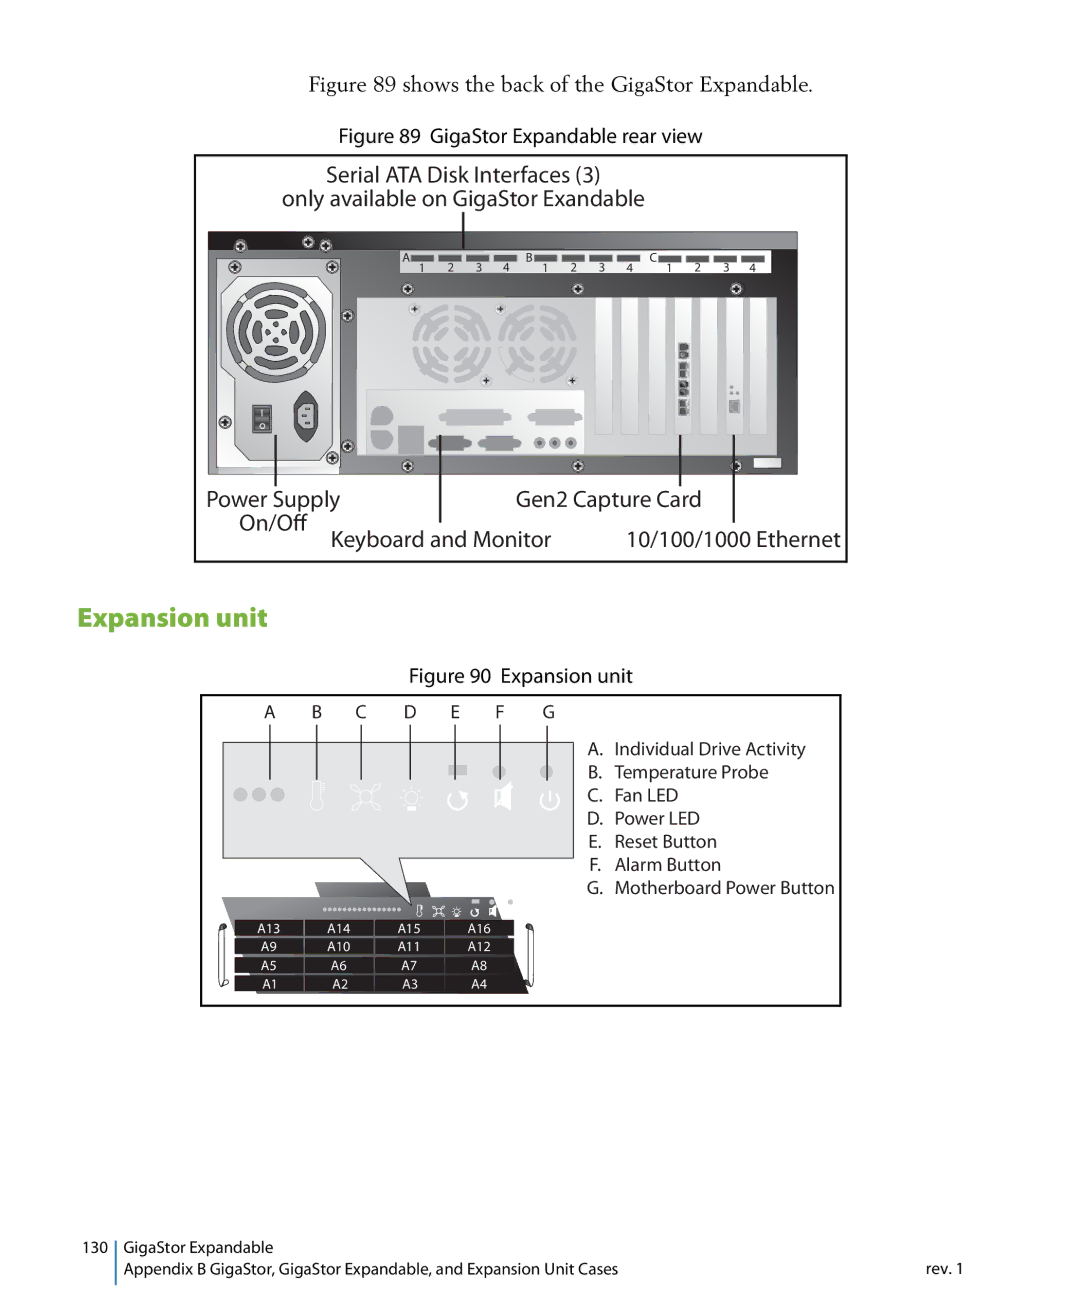
GigaStor Expandable
Controller unit
Expansion unit
C D E F G
Reset Button
Temperature probe
Alarm Button
Rev
GigaStor Portable
134 Appendix C GigaStor Portable
TAP bay
Running Observer passively
Portable GigaStor
Using the portable GigaStor as a probe
Rev
Index
Encapsulation 34-35 Hssi
DS3/E3 TAP 47ff
Capture Buffer Memory 26ff
Hssi 15, 34, 48-49 probe settings
Packet alert threshold
Packet filters
T1 82 Dlci 83 monitoring
T1/E1 WAN
WAN
25 80, 82, 84-85 XFP 14-15, 116 Gen2 card
Rev 145
146 Rev