Nokia E61 User Guide
Page
Page
Contents
Select ringing tones for contacts File manager
Data and software management
108
103
106
111
For your safety
Only qualified personnel may install or repair this product
Your device is not water-resistant. Keep it dry
About your device
Enhancements, batteries, and chargers
For your safety
Insert the SIM card and battery
Get started
Insert and remove a memory card
Charge the battery
Switch on your device
Connect the charger to a wall outlet
Enter first settings
Keys and parts
Set the time, and select OK Set the date, and select OK
Key functions
Blue function key
Keypad lock keyguard
Shift keys
Menu key
Connectors
Antennas
Your device has two internal antennas
About the display
Volume control
Active standby mode
Standby modes
Display indicators
Standby mode
To open Services and connect to the Web, press
Memory
Memory details
Memory card security
Back up and restore to the memory card
Memory card
Format a memory card
Nokia support and contact information
Help and tutorial
Nokia PC Suite
Device help
Get started
Your device
Menu
Write text
Change the writing language
Copy and paste text
Common actions in several applications
Transfer content between devices
Bluetooth connectivity
Infrared connectivity
Synchronize data with another device
Organize messages
Messaging settings
Messages
Search for messages
To start entering the e-mail settings, select Start
Other settings
Set up your e-mail
Mail messages
Configure the e-mail key
Select your default mailbox
Connect to mailbox
Mail indicator light
View e-mail offline
Read and reply to e-mail
Delete messages
Mail folders
Write and send e-mail
Settings for sent e-mail
Mail account settings
Settings for the received e-mail
Select Menu Messag. Mailbox
Automatic retrieval settings
User settings
Retrieval settings
Folder subscriptions for IMAP4 mailboxes
Reply to received text messages
Text messages
Write and send text messages
Text messages on the SIM card
Picture messages
Text message settings
Select Options Settings Text message. Define the following
Forward picture messages
Create presentations
Multimedia messages
Create and send multimedia messages
Address fields
Scroll to a text area and enter the text
Receive and reply to multimedia messages
View presentations
Reply
Multimedia message settings
View media objects
Search IM users or IM groups
Instant messaging
Connect to an IM server
Select Menu Connect. IM
Ban from groups
Conversations with a single IM user
IM groups
From IM contacts Ban one or several of your IM contacts
IM contacts
Settings
Select Options Settings IM settings
Blocked contacts
Select Options Settings Server settings
Send service commands
IM server settings
Special messages
Make calls
Speed dial
Divert calls
Select Menu Tools Settings Call barring
Answer a call
Call barring
Video calls
Log
Net call barring
Select Menu Connect. PTT
Select Options Settings User settings
Push to talk
Define the following
Push to talk calls
Log in to push to talk service
Connection settings
Callback requests
Register PTT channels
Contacts view
Create a channel
Join a channel
Exit push to talk
Define the net call settings
Net calls
Select Menu Connect. Internet tel
Connect to the net call service
Connect using a shortcut
Make net calls
Voice commands
Service settings
Select Menu Tools Voice cm
Launch an application
Voice command settings
Make a call
Change profiles
Contacts
Manage contact groups
Select Menu Contacts
Copy contacts between SIM and device memory
Select ringing tones for contacts
Business cards
Contacts
To-do
Calendar
Create calendar entries
Select Menu Organiser Calendar
Calendar views
Add a received calendar entry to your calendar
Select Menu Clock
Alarm clock
Clock
Time format Select 24-hour or 12-hour
Dev. mgr.-See Remote configuration network service, p
Internet access points
Set up an Internet access point for packet data Gprs
Select Menu Tools Settings Connection Access points
Set up an Internet access point for wireless LAN
Data bearer Select Wireless LAN
Data bearer Select Packet data
Cable connection
Wireless LAN
Select Menu Tools Settings Connection Wireless LAN
Select Menu Connect. Data cbl
Bluetooth
Start using Bluetooth
Select Menu Connect. Bluetooth
Send data
Bluetooth connectivity indicators
Security tips
Pair devices
SIM access profile
Receive data
Authorize a device
Manage the SIM access profile
Infrared
Send and receive data
Data connections
Packet data
GSM network is indicated with , the Umts network with
Wireless local area network Wlan
Connection manager
Select Menu Connect. Conn. mgr
View and end active connections
Search for wireless LAN
Modem
Select Menu Connect. Modem
Mobile VPN
Access point groups
Select Menu Tools Settings Connection Access point groups
Email data roaming
Web
Access points
Select Menu Web network service
Browse the Web
End a connection
Bookmarks
Download items
To purchase items
News feeds and blogs
Web settings
Select Menu Web Options Settings
Clear the cache
Services
Documents
Office applications
File manager
View objects in a document
Edit documents
View document structure
Preview the page layout
Table editor
Sheet
Find text
Work with worksheets
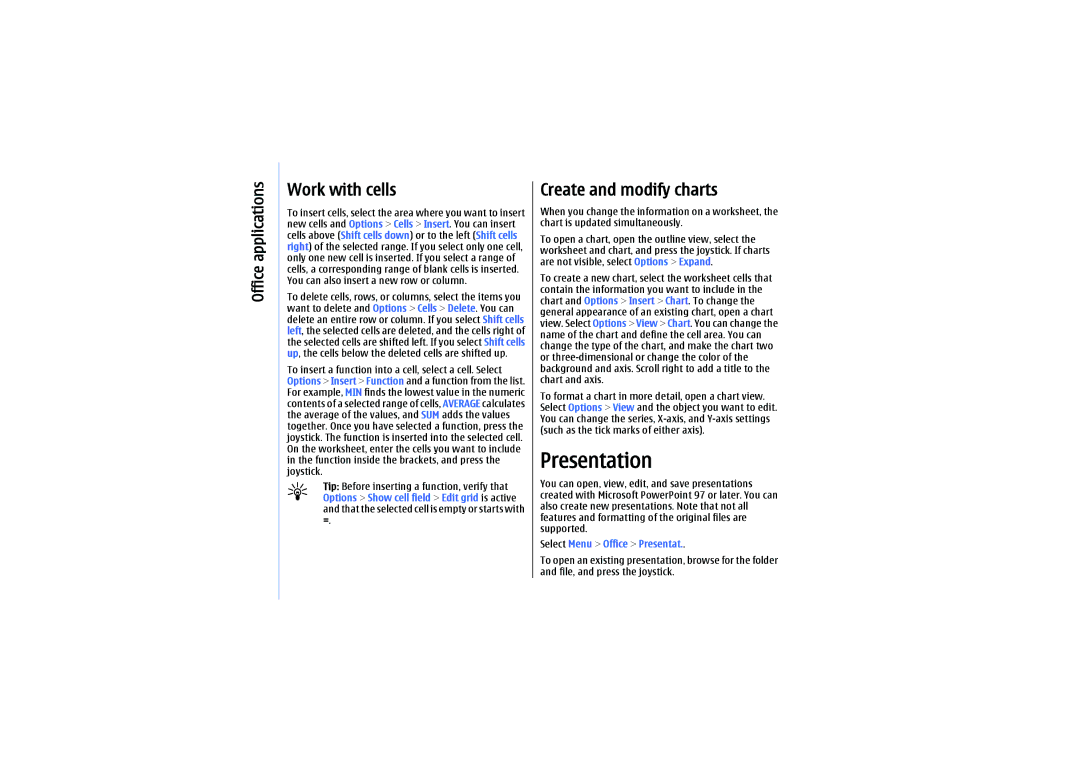
Work with cells
Create and modify charts
Presentation
Select Menu Office Presentat
Layout view
Work with different views
View slide shows
Outline view
Edit presentations
Show screen content
Screen export
Find text in a presentation
Print
Converter
Organiser
Calculator
Convert measurements
Select Done Yes to save the changes
Voice mailbox
Set base currency and exchange rate
Select Menu Organiser Voice mail
Application manager
Remote configuration settings
Data and software management
Data synchronization
Create a synchronization profile
Sett. wiz
Tools
Nokia Catalogs
Voice aid
Tools
Media applications
Gallery
Images
Manage image files
RealPlayer
Play video clips and stream links
Select Menu Media RealPlayer
Network settings
Video settings
Proxy settings
Music player
Track lists
Adjust music volume
Listen to music
Equalizer
Play a voice recording
Recorder
Flash player
Select Menu Media Recorder
Personalization
Profiles
Select Menu Tools Profiles
Themes
Select Menu Tools Themes
General settings
Settings
Phone settings
Standby mode settings
Call settings
Display settings
Select Call and from the following
Connection settings
Access points
Packet data settings
Net call settings
Data call settings
Select Menu Tools Settings Connection Packet data
VPN access point settings
Wireless LAN
VPN access points
Advanced Wlan settings
EAP plug-in settings If you selected WPA mode
Security settings for wireless LAN access points
Authentication type Select Open or Shared
EAP plug-in settings If you select WPA mode
Enhancement settings
Date and time settings
Security settings
Configurations
102
Security
Define security settings
Select Menu Tools Settings Security Phone and SIM
Device security
Change the barring password
Fixed dialing
See Security settings for wireless LAN access points, p
Certificates should be used when you connect to an
Tip When you add a new certificate, check its authenticity
Certificate manager
Applications
Active standby mode
Shortcuts
Image viewer
Switch between the full screen size and normal view
Zoom
Rotate clockwise
Battery information
MAh Li-Ion battery BP-5L information
109
110
Care and maintenance
Operating environment
Additional safety information
Additional safety information
Medical devices
Vehicles
Emergency calls
Hearing aids
Certification Information SAR
115
Index
Gprs See Gprs
Pairing
Feeds File manager 75 flash player Gallery
Images
Volume 17
Selection key settings
Voice commands
Playing Music
General Security settings Settings
Write text Writing language
MANUFACTURER’S Limited Warranty
What is not covered?
Limitation of Nokias liability
Page
Nokia Care Online