3Software
3.4.2 Graph Tab
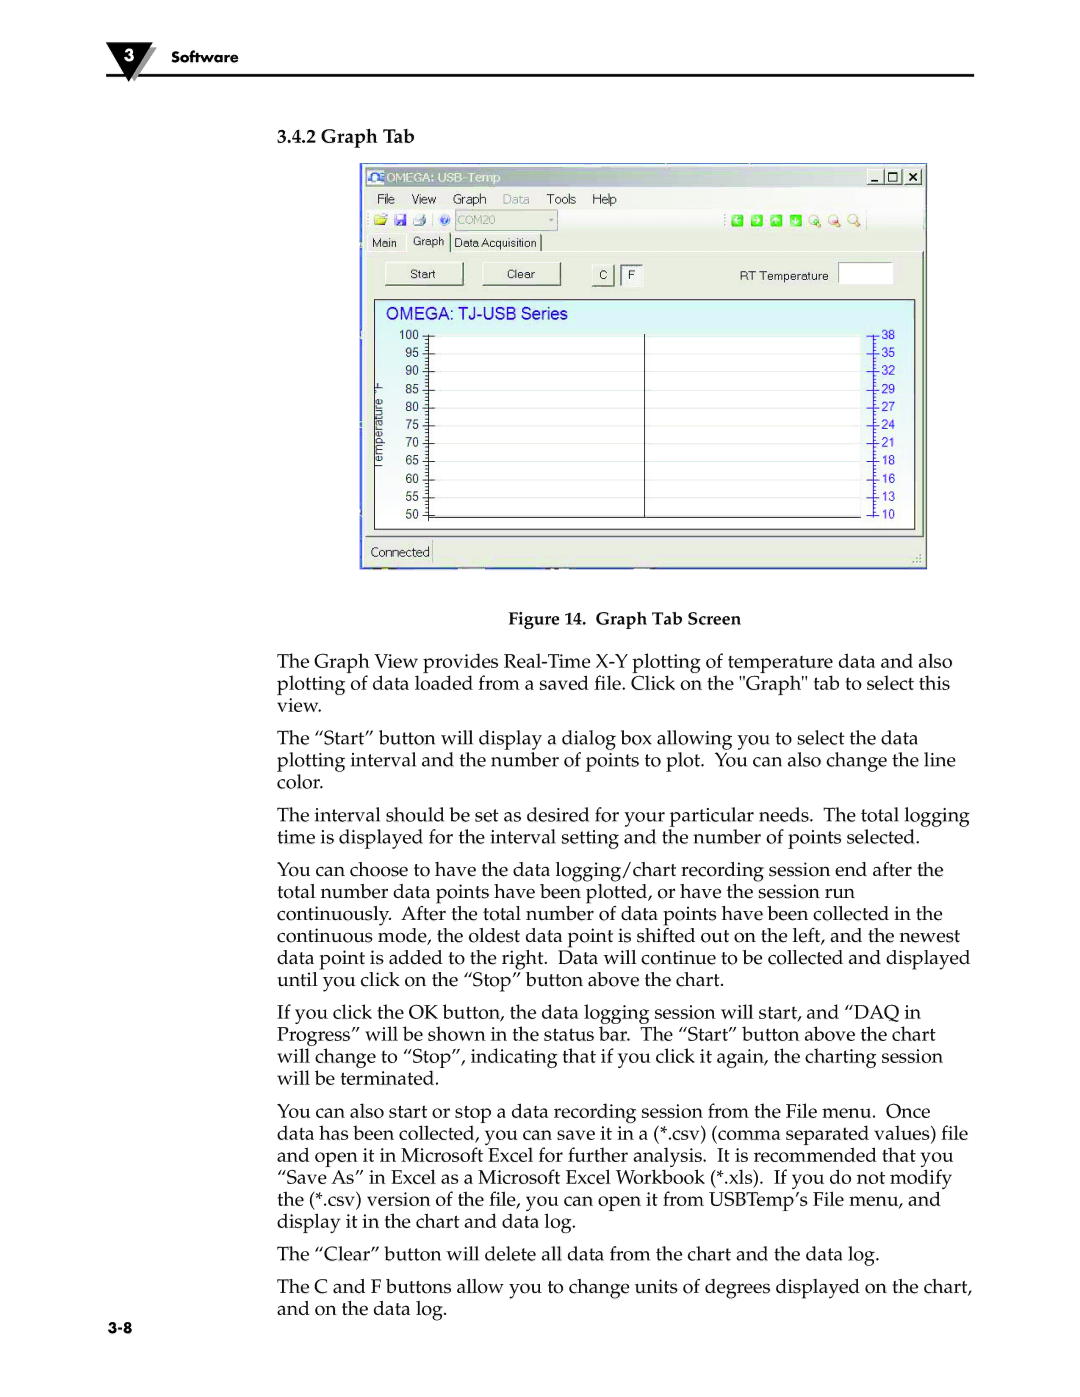
Figure 14. Graph Tab Screen
The Graph View provides
The “Start” button will display a dialog box allowing you to select the data plotting interval and the number of points to plot. You can also change the line color.
The interval should be set as desired for your particular needs. The total logging time is displayed for the interval setting and the number of points selected.
You can choose to have the data logging/chart recording session end after the total number data points have been plotted, or have the session run continuously. After the total number of data points have been collected in the continuous mode, the oldest data point is shifted out on the left, and the newest data point is added to the right. Data will continue to be collected and displayed until you click on the “Stop” button above the chart.
If you click the OK button, the data logging session will start, and “DAQ in Progress” will be shown in the status bar. The “Start” button above the chart will change to “Stop”, indicating that if you click it again, the charting session will be terminated.
You can also start or stop a data recording session from the File menu. Once data has been collected, you can save it in a (*.csv) (comma separated values) file and open it in Microsoft Excel for further analysis. It is recommended that you “Save As” in Excel as a Microsoft Excel Workbook (*.xls). If you do not modify the (*.csv) version of the file, you can open it from USBTemp’s File menu, and display it in the chart and data log.
The “Clear” button will delete all data from the chart and the data log.
The C and F buttons allow you to change units of degrees displayed on the chart, and on the data log.
