HOW TO INTERPRET THE
CALCULATED RESULTS
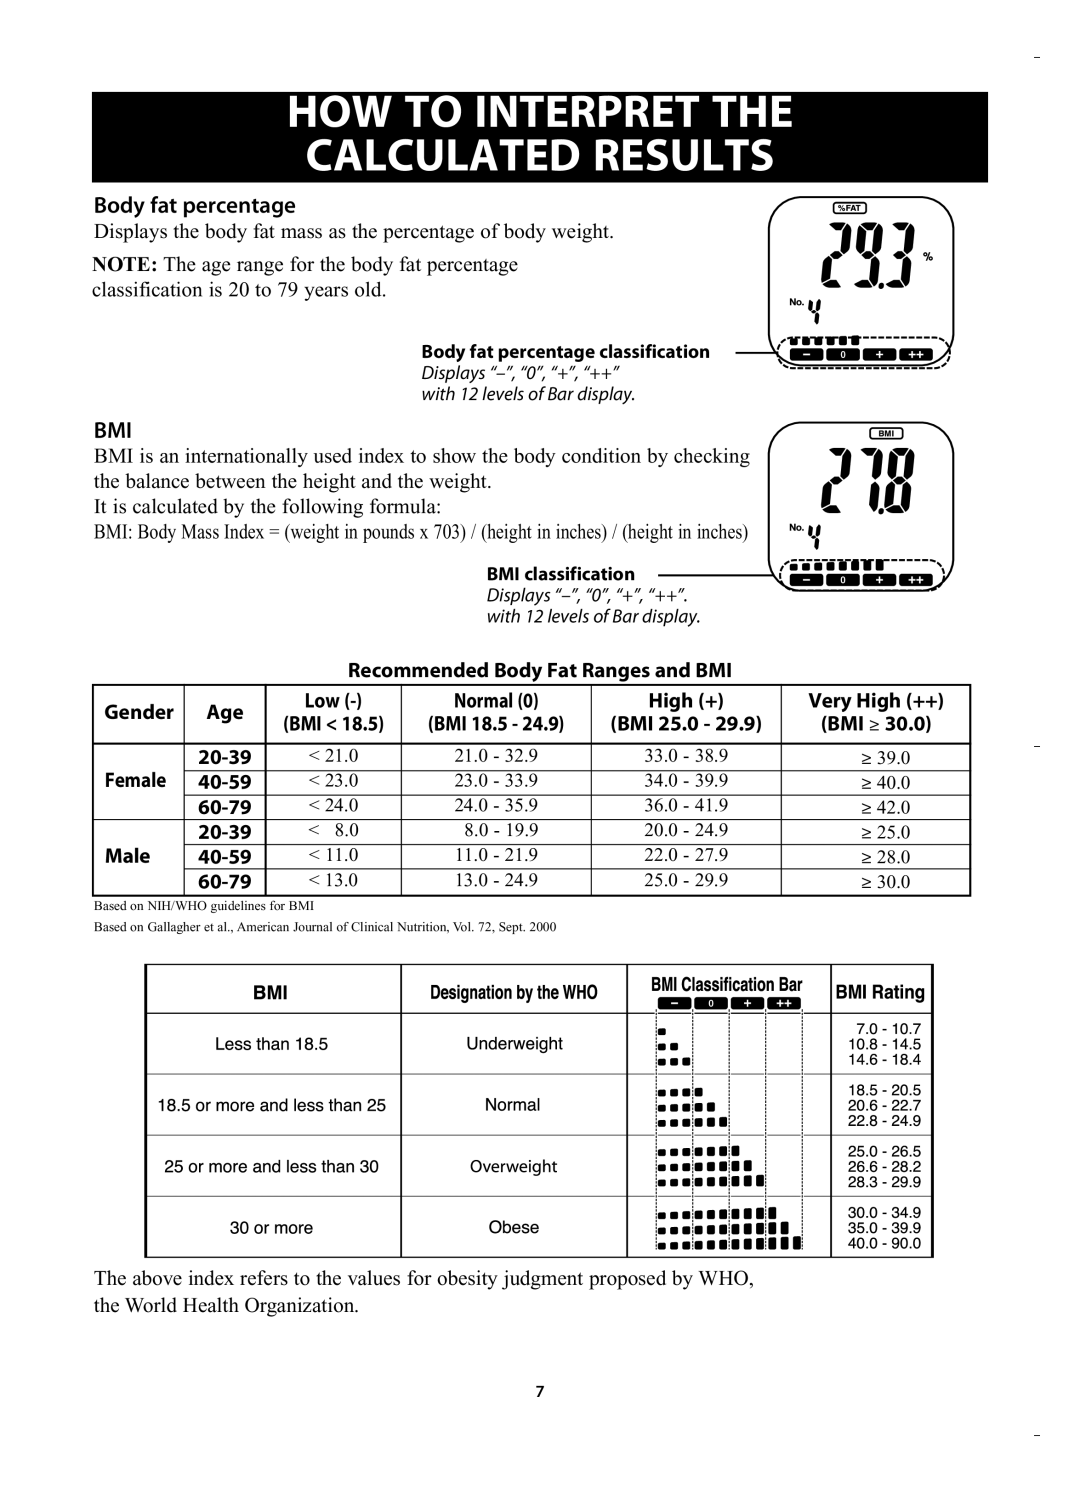
Body fat percentage
Displays the body fat mass as the percentage of body weight.
NOTE: The age range for the body fat percentage classification is 20 to 79 years old.
Body fat percentage classification
Displays
with 12 levels of Bar display.
BMI
BMI is an internationally used index to show the body condition by checking the balance between the height and the weight.
It is calculated by the following formula:
BMI: Body Mass Index = (weight in pounds x 703) / (height in inches) / (height in inches)
BMI classification Displays
Recommended Body Fat Ranges and BMI
Gender | Age | Low | Normal (0) | High (+) | Very High (++) | ||||
(BMI < 18.5) | (BMI 18.5 - 24.9) | (BMI 25.0 - 29.9) | (BMI ≥ 30.0) | ||||||
|
| ||||||||
|
|
|
|
|
|
|
|
| |
Female |
| < 21.0 | 21.0 | - 32.9 | 33.0 - 38.9 |
|
| ≥ 39.0 | |
|
| ||||||||
|
|
|
|
|
|
|
| ||
| < 23.0 | 23.0 | - 33.9 | 34.0 - 39.9 |
|
| ≥ 40.0 | ||
|
| ||||||||
|
|
|
|
|
|
|
|
| |
|
| < 24.0 | 24.0 | - 35.9 | 36.0 - 41.9 |
|
| ≥ 42.0 | |
|
|
| |||||||
|
|
|
|
|
|
|
|
| |
Male |
| < 8.0 | 8.0 | - 19.9 | 20.0 - 24.9 |
|
| ≥ 25.0 | |
|
| ||||||||
|
|
|
|
|
|
|
| ||
< 11.0 | 11.0 | - 21.9 | 22.0 - 27.9 |
|
| ≥ 28.0 | |||
|
| ||||||||
|
|
|
|
|
|
|
|
| |
| < 13.0 | 13.0 | - 24.9 | 25.0 - 29.9 |
|
| ≥ 30.0 | ||
|
|
| |||||||
|
|
|
|
|
|
|
|
| |
Based on NIH/WHO guidelines for BMI
Based on Gallagher et al., American Journal of Clinical Nutrition, Vol. 72, Sept. 2000
The above index refers to the values for obesity judgment proposed by WHO, the World Health Organization.
7