Operating Manual
Thank you for buying the Pentax Digital Camera
For using your camera safely
About the Camera
About the Battery Charger and the AC Adapter
Page
Care to be Taken During Handling
Regarding Product Registration
Contents
Recording and Playback of Sound
Playback/Deleting/Editing
Settings
Appendix
Contents of the Operating Manual
Checking the Contents of the Package
Front
Names of Parts
Back
Four-way controller
Names of Operating Parts
Guide Indications
Attaching the Strap
Powering the Camera
Installing the Battery
Removing the Battery
Open the battery/card cover
Charging the Battery
Battery Level Indicator
Recycling Batteries
Charging the Battery Abroad
Denmark, Germany, Norway, Hungary, Finland
Using the AC Adapter optional
Precautions When Using the Battery Charger or AC Adapter
Installing the SD Memory Card
Data Backup
Precautions When Using an SD Memory Card
Appropriate Sizes According to Use
Image Size and Quality of Still Pictures
Appropriate Quality According to Use
Approximate Number of Recordable Images by Size and Quality
Size and Quality of Movies
Appropriate Sizes Recorded Pixels According to Use
Default setting is C
Press the four-way controller
Setting the Display Language
Use the four-way controller To select a language
Setting the Date and Time
Press the OK button Press the four-way controller
Use the four-way controller 23 to change the month
Ntsc
Press the shutter release button halfway
Press the shutter release button fully
Using the Shutter Release Button
Press halfway
Press down fully
Instant Review
Playing Back an Image
Playing Back the Previous or Next Image
Press the Q Playback button
After taking a picture
Press the Green button when playing back an image
Deleting the Displayed Image
Using the My Album Function
Press the power switch
Press the power switch again
Turning the Camera On and Off
Turning the Camera On in Playback Mode
Press the power switch while pressing the QPlayback button
Using the Button Functions
Capture Mode
Playback Mode
For playing back voice recording files 1p.110
Voice Recording Mode
Shutter release button
Setting the Menus
How to Set the Menus
Use the four-way controller 23 to change the setting
To Save the Setting and Start Taking Pictures
To Save the Setting and Begin Playback of Images
To Save the Setting and Continue with Menu Operations
To Cancel the Changes and Continue with Menu Operations
Press the OK button or the four-way controller
Example of Menu Operation
Menu button
Menu List
Rec.Mode Menu
Set-up Menu
How to operate the Mode Palette
Operating the Mode Palette
Mode Palette List Capture Mode Palette
Portrait mode
Playback Mode Palette
Dpof
Changing the Mode
Selecting the Capture Mode
Displaying Shooting Information in Capture Mode
Taking Pictures
Histogram Display
Grid Display
No icons
Backlight Off
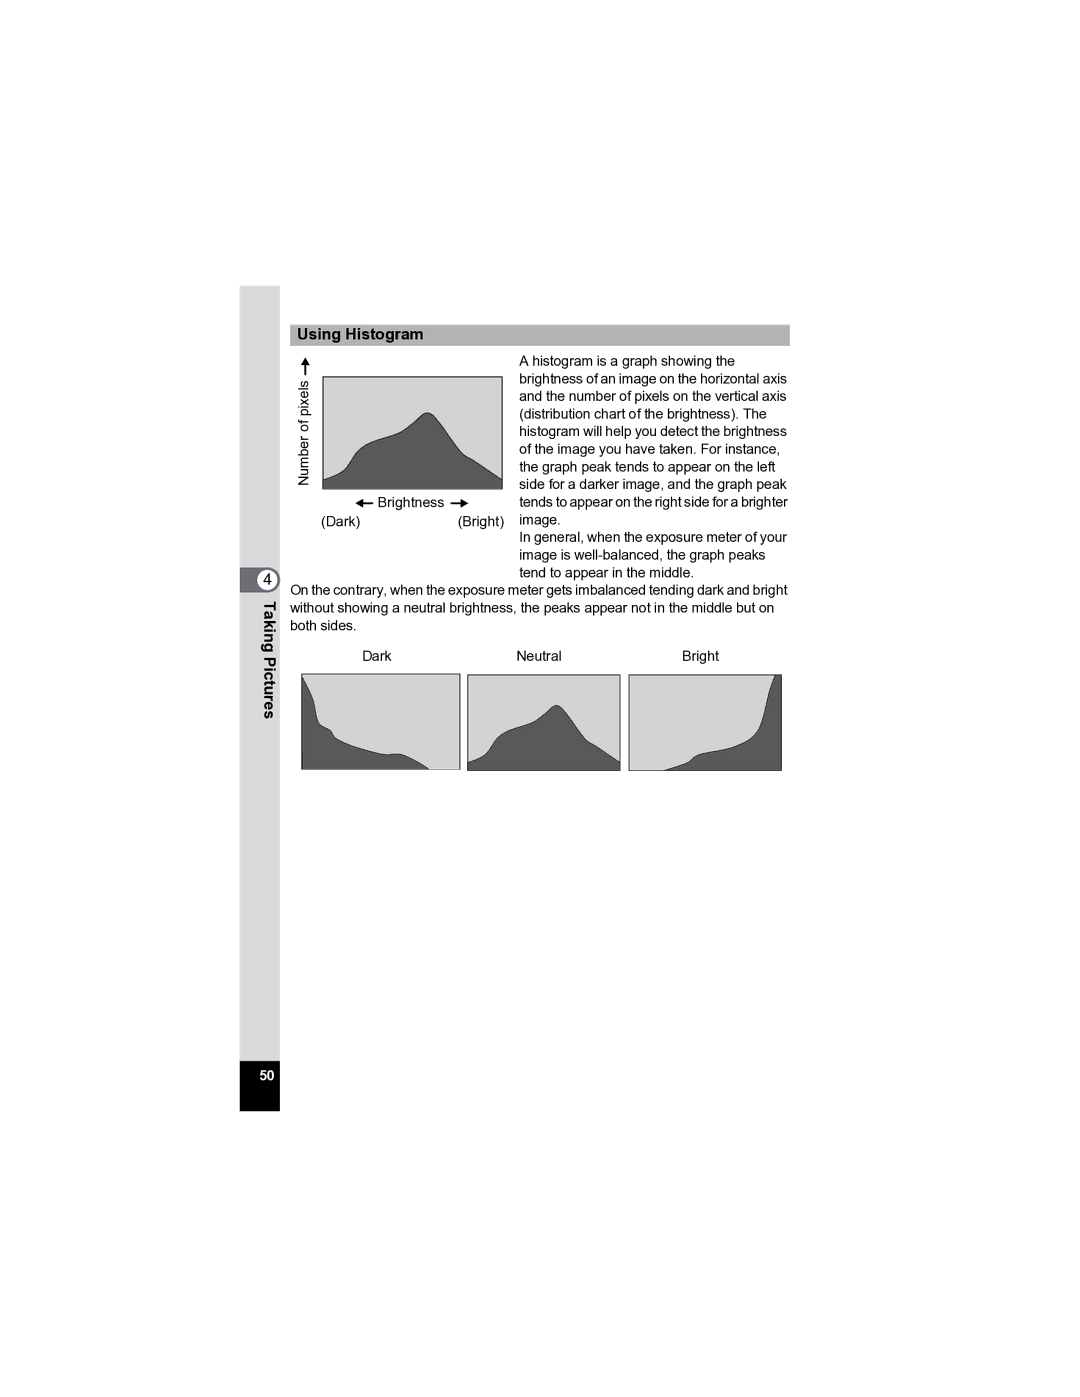
Using Histogram
Taking Pictures Using the Shake Reduction Function
Press the Shake Reduction preview button
Press the Green button in Capture
Taking Pictures in the Basic Mode Green Mode
Mode
Auto
Taking Pictures Automatically Auto Picture Mode
Press the four-way controller 3 in Capture mode
To select Auto Picture mode Press the OK button
Use the four-way controller
TakingPictures
Using the Exposure Mode and Other Fuctions
Effect of Aperture and Shutter Speed
To Select the Program mode
Use the four-way controller 2345 to select R Program mode
To Select the Shutter Priority mode
To Select the Manual Exposure mode
Press the OK button
Press the four-way controller 3 Capture mode
Use the four-way controller 2345 to select a desired mode
Press the OK button Press the shutter release button halfway
Taking Pictures of People Portrait Mode/Kids Mode
Use the four-way controller 2345 to select Portrait mode
Pictures
Press the OK button
Press the OK button
Use the four-way controller 2345 to select EPet mode
Taking Pictures of Your Pet Pet Mode
Press the four-way controller 45 to adjust the contrast
Taking Pictures of Text Text Mode
Use the four-way controller 23 to select
Taking Pictures of Dark Scenes Night Scene Mode
Blur reduction
Taking Movies Movie Mode
To select C Movie mode Press the OK button
Keeping the Shutter Release Button Pressed
To select Y Frame Composite
Taking Pictures in Frame Composite mode
Use the four-way controller 45 to select a frame
To Register a New Frame
Using the Self-timer
Press the four-way controller 2 in Capture mode
Continuous Shooting Continuous Shooting Mode
Using the Remote Control Unit optional
Press the shutter release button on the remote control unit
Taking Pictures Using the Remote Control
Control Press the OK button
Changing the Magnification Using the Remote Control Unit
Press the zoom button on the remote control unit
Life of the Battery for the Remote Control Unit
Using the Zoom to Change the Subject Size
Press the zoom button in Capture mode
Press the Menu button in Capture mode
Setting the Digital Zoom
Selecting the Focus Mode
Setting the Shooting Functions
Focus Mode
To select the focus mode
Press the four-way controller 5 in Capture mode
Manual Focus
TakingPictures
Selecting the Flash Mode
Flash Mode
Flash Mode Auto
Selecting the Recorded Pixels of Still Pictures
Number of Recorded Pixels
Number of shots for the selected recording pixels appears
Selecting the Quality Level of Still Pictures
Quality Levels
Adjusting the White Balance
White Balance Taking Pictures
Select K Manual on the White
Manual Setting
Balance screen
Selecting the Autofocus Settings
Use the four-way controller 23 to select AF Setting
Changing the Focusing Area
Focusing Area
Setting the Focus Limiter
Setting the Auxiliary AF Light
Setting the Light Metering Mode to Determine the Exposure
AE Metering Modes
Use the four-way controller 23 to select Sensitivity
Setting the Sensitivity
Sensitivity
Use the four-way controller 23 to select the sensitivity
Select Auto and press Four-way controller
Selecting the Sensitivity
Selecting the Sensitivity and ISO Correction Range
Setting the Exposure EV Compensation
Selecting the Settings for Taking Movies
Use the four-way controller 23 to select Movie
Selecting the Recorded Pixels of Movies
Recorded Pixels
To select Recorded Pixels
Selecting the Quality Level of Movies
Compensating for Camera Shake While Taking Movies
Setting the Shake Reduction for Still Pictures
Taking
Setting the Instant Review Time
Setting the Green Button
To select Green Button
Registering Frequently Used Functions Fn Setting
Press the OK button
Initial settings for Fn Setting
Functions that can be registered on Fn Setting
Setting the Image Sharpness
To adjust sharpness
To select Sharpness
Softens the contours + Sharpens the contours
Setting the Color Saturation
To adjust saturation
To select Saturation
Reduces the saturation + Increases the saturation
Setting the Image Contrast
To adjust contrast
To select Contrast
Reduces the contrast + Increases the contrast
Saving the Settings
Saving the Menu Items Memory
107
Recording
Recording Sound Voice Recording Mode
Sound
Playback of Sound
Playing Back Sound
000011
Adding a Voice Memo
Recording a Voice Memo
Playing Back a Voice Memo
Playing Back Still Pictures
Playing Back Images
Zoom Display
Setting the Quick Zoom Function
Playing Back Movies
Displaying Shooting Information in Playback Mode
Recorded pixels Quality level White balance
Sensitivity Histogram
Playback/Deleting/Editing Aperture
Nine-Image Display/Calendar Display
Nine-Image Display
Playback mode, press w/f on the zoom button
Calendar Display
Slideshow
Use the four-way controller 3 to select Screen Effect
Use the four-way controller 45 to select the effect
Deleting a Single Image, Movie or Sound
Deleting Images, Movies and Sounds
Use the four-way controller 2 to Select Delete
Deleting a Voice Memo only
Enter the Playback mode and press the Green button twice
Deleting All Images
Enter the Playback mode and press w/f on the zoom button
125
Protecting Images, Movies and Sounds from Deletion Protect
To select Z Protect
To select Select image/sound
Protecting Images, Movies and Sounds
Protecting All Images, Movies and Sounds
Viewing Images on AV Equipment
Turn the AV equipment on
Turn the camera on
Cable Playback/Deleting/Editing
Playing Back an Image Using the Remote Control Unit optional
Printing Single Images
Setting the Printing Service Dpof
To select Dpof Press the OK button
131
Enter the Playback mode and press the four-way controller
Printing All Images
Connecting the Camera to the Printer
Direct Printing Using PictBridge
Select PictBridge for USB Connection on the H Set-up menu
134
Use the four-way controller 2345 to select the paper size
Press the OK button twice
Printing Using the Dpof Settings
Disconnecting the Camera from the Printer
Editing Images
Changing the Image Size and Quality
To select Resize Press the OK button
Resizing Single Images
To change the quality
Use the four-way controller To select Cropping
Cropping Images
Crop the image
Rotating the Displayed Image
Playback mode, use the four-way controller 45 to
To select s Image Rotation Press the OK button
Press the four-way controller Or the four-way controller
Editing Pictures with Color Filters
To select Color Filter Press the OK button
Use the four-way controller 23 to select Overwrite
Or Save as Press the OK button
Use the four-way controller 23 to select Eight colors
Selecting the Color Filter Eight Colors
Editing Pictures with the Digital Filter
To select Digital Filter Press the OK button
Selecting the Slim Filter
Editing Pictures with Brightness Filter
Use the four-way controller To select Brightness Filter
146
Editing Movies
Saving a Frame from a Movie as a Still Picture
Point you want to save
Dividing a Movie
Select Extract on the Movie Edit screen Press the OK button
Extracting Movies
Removing Red-eye
To select Z Red-eye Compensation Press the OK button
Specify the area for compensation
Removing Red-eye Manually
Adding a Frame Frame Composite
Use the four-way controller 2345 to select Y
Frame Composite Press the OK button
To select a frame
153
Copying Files
Use the four-way controller 2345 to select Image/Sound Copy
To select the file to copy Press the OK button
To Copy Files from the Built-in Memory to the SD Memory Card
Camera Settings
Setting Up the Start-up Screen
157
Formatting an SD Memory Card or the Built-in Memory
Select Format on the H Set-up menu
Use the four-way controller 2 to
Select Format
Changing the Sound Settings
To change the operation volume
Select Playback Volume
Changing the Volume
To select Start-up Sound
Changing the Sound
Select User in in Changing the Sound Press the OK button
Changing the Sound Using a Recorded Sound File
Use the four-way controller 45 to select a sound file
Changing the Date and Time
To change the month
Setting the World Time
Press the four-way controller 3 to select Destination
Press the four-way controller 3 to select W Hometown
Changing the Display Language
Four-way Controller OK button Menu button
Changing the Image Folder Name
Folder Name
Changing the USB Connection Mode
Changing the Video Output Format
Use the four-way controller 23 to select Ntsc or PAL
Adjusting the Brightness of the LCD Monitor
Playback button Four-way controller Menu button
Setting Power Saving
Setting Auto Power Off
Setting the Guide Display
Resetting to Default Settings
List of City
Default Settings
Last Memory Setting
Reset Setting
Rec. Mode Menu Items
176
Playback Mode Palette Items
Capture Mode and Functions
Yes Available No Not available
Capture Mode and Default Setting of Each Function
Optional Accessories
Memory card error
Messages
182
Troubleshooting
Problem Cause Remedy
184
Main Specifications
Camera
186
Power Supply
NTSC, PAL
Warranty Policy
CE Mark is a Directive conformity mark of the European Union
For customers in Canada
For customers in USA
Pour les utilisateurs au Canada
Declaration of Conformity
Information on disposal for users
Index
194
195
Memo
Memo