16

To:

IEEE Display Mode

SETUP

Demand

DEMND


D KW


DKVAR


D KVA


M KW


MKVAR


M KVA


M KW


MKVAR


M KVA


Present


Present


Present


Maximum Real


Maximum Reactive


Maximum Apparent


Maximum Real


Maximum Reactive

Maximum Apparent

DEMND


Real Power


Reactive Power

Apparent Power


Power (P)


Power (Q)


Power (S)


Power (P)


Power (Q)


Power (S)


Demand (P)


Demand (Q)

Demand (S)

Import Demand

Import Demand

Import Demand

Export Demand

Export Demand


Export Demand


Phase C:

CPHAS

C

A

C VAC

C VLN

C

KW

CKVAR


3 Phase

C

KVA

C

PF

C +KWh

C -KWh

Systems Only


CPHAS

Phase B:


2 & 3 Phase

BPHAS


B A


B VBC


B VLN


B KW


BKVAR


B KVA


B PF


B +KWh


B -KWh


Systems Only


BPHAS

Phase A:

APHAS

A

A

A VAB

A VLN

A

KW

AKVAR

A KVA

A

PF

A +KWh

A -KWh

All Systems


APHAS


1, 2, or 3 Phase


_PHAS


3 A


3 VLL


3 VLN


3 KW


3KVAR


3 KVA


3 PF


3 +KWh


3 -KWh


HZ

Summary Data


Amps (A)


Volts Line-Line (U)

Volts Line-Neutral (V)

Total Real


Total Reactive


Total Apparent


Power Factor


Total Import

Total Export

Frequency


(Average of

(Average of Active

(Average of Active

Power (P)


Power (Q)

Power (S)

(Average of

Real Energy

Real Energy


Active Phases)


Phases)


Phases)


Active Phases)


>>> Scroll When Idle >>>

_PHAS

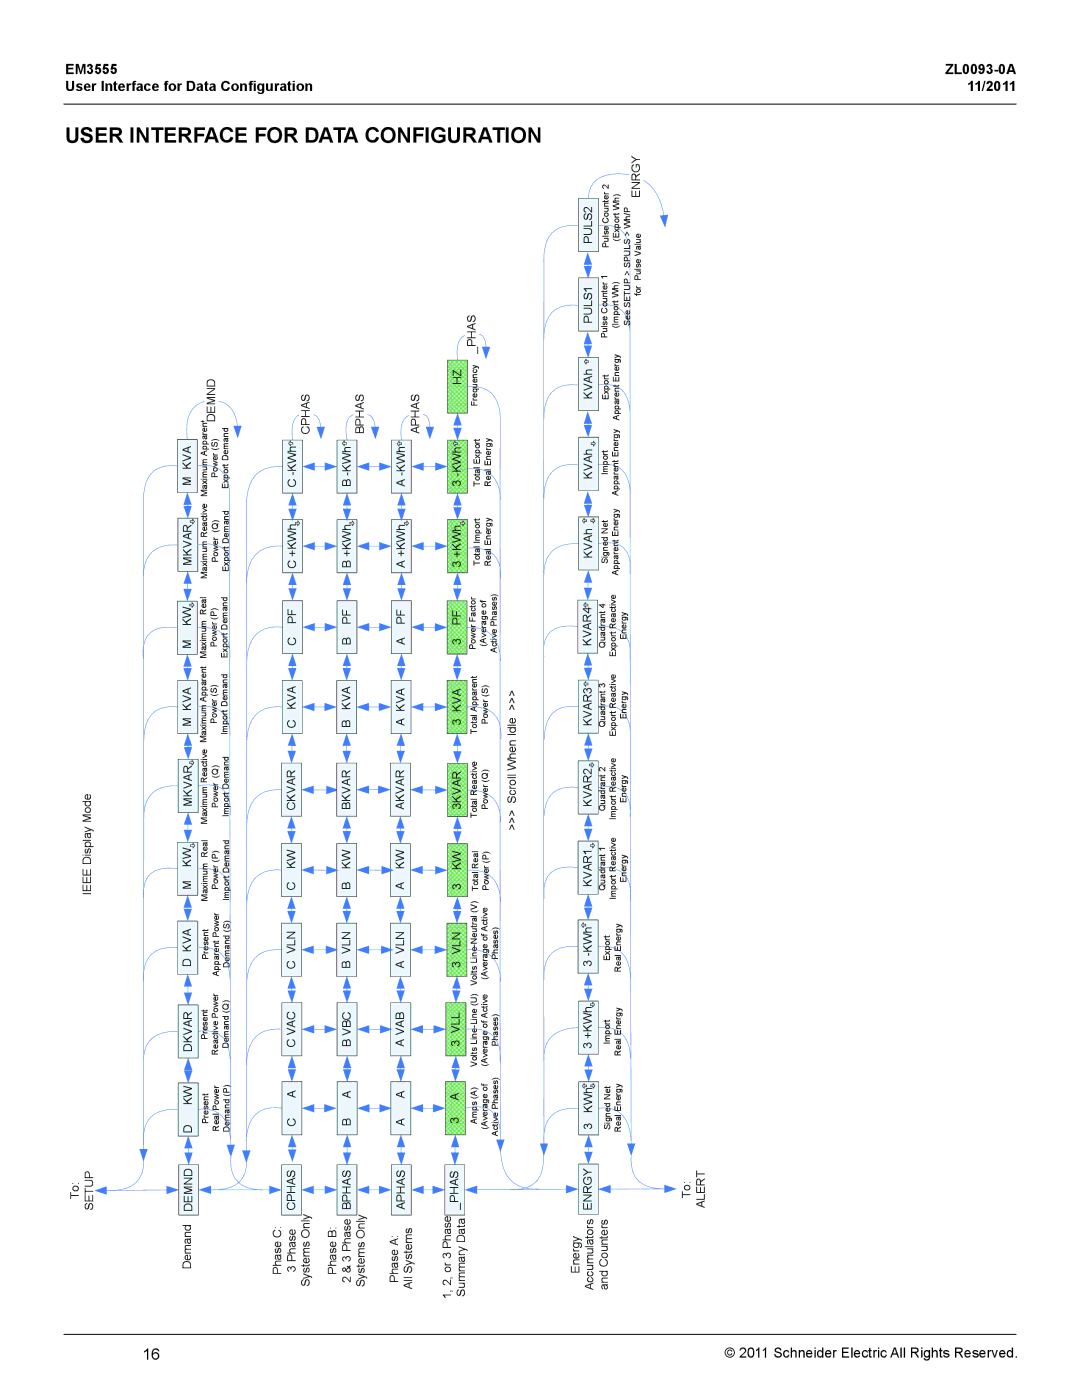
USER INTERFACE FOR DATA CONFIGURATION

User Interface

EM3555

for Data Configuration


© 2011 Schneider Electric All Rights Reserved.

Energy

ENRGY

3 KWh

3 +KWh

3 -KWh

KVAR1

KVAR2

KVAR3

KVAR4

KVAh

KVAh

KVAh

PULS1

PULS2


Accumulators


and Counters


Signed Net

Import

Export

Quadrant 1

Quadrant 2

Quadrant 3

Quadrant 4

Signed Net

Import

Export

Pulse Counter 1

Pulse Counter 2


Real Energy

Real Energy

Real Energy

Import Reactive

Import Reactive

Export Reactive

Export Reactive

Apparent Energy

Apparent Energy

Apparent Energy

(Import Wh)

(Export Wh)


Energy

Energy

Energy

Energy


See SETUP > SPULS > Wh/P

ENRGY


for Pulse Value

To:

ALERT

ZL0093-0A 11/2011

Page 20
Image 20
Schneider Electric EM3555 manual For Data Configuration

EM3555 specifications

Schneider Electric EM3555 is a highly efficient energy monitoring device that plays a crucial role in optimizing energy management across various applications. As part of Schneider Electric’s extensive range of products, the EM3555 is designed for professionals who seek robust solutions for monitoring energy usage and improving operational efficiency.

One of the main features of the EM3555 is its advanced energy consumption monitoring capabilities. It provides real-time data on electrical parameters, including voltage, current, frequency, power factor, and active/reactive power. This level of detailed information helps organizations understand their energy consumption patterns, identify inefficiencies, and take corrective actions to enhance energy performance.

The EM3555 is equipped with a user-friendly display that allows for easy access and navigation through various metrics. This display offers visibility into key performance indicators and alerts users to any anomalies in energy consumption. Enhanced energy visibility is critical for effective decision-making and is particularly beneficial in environments where energy management is paramount.

In terms of technology, the EM3555 incorporates the latest communication protocols, including Modbus RTU. This feature facilitates seamless integration with existing systems, enabling users to collect and analyze data efficiently. Furthermore, the EM3555 can be connected to Schneider's EcoStruxure platform, which offers advanced analytics and insights into energy usage, harnessing the power of IoT for smarter energy management.

Another notable characteristic of the EM3555 is its compact design, making it suitable for various installation environments, including electrical panels and equipment rooms. The device is built to withstand harsh industrial conditions, ensuring long-term reliability and durability.

In conclusion, the Schneider Electric EM3555 is an exemplary energy monitoring solution that combines advanced features, cutting-edge technology, and robust characteristics. By providing real-time insights into energy consumption, the EM3555 empowers organizations to improve their energy efficiency, reduce costs, and contribute to sustainability goals. Its integration capabilities with other systems further underline its value in contemporary energy management practices. With the EM3555, Schneider Electric continues to lead the way in developing innovative solutions for a more sustainable future.