2 0 0 | 4 0 0 | 6 0 0 | 8 0 0 | 1000 | 1200 |
36
-3 2
0)
i 2 8
Y
2 2 4
0Y
12 0
P
316
L
JI 2
0
8
4
0
5 0 | 100 | 1% | 2 0 0 | 2 5 0 | 3 0 0 |
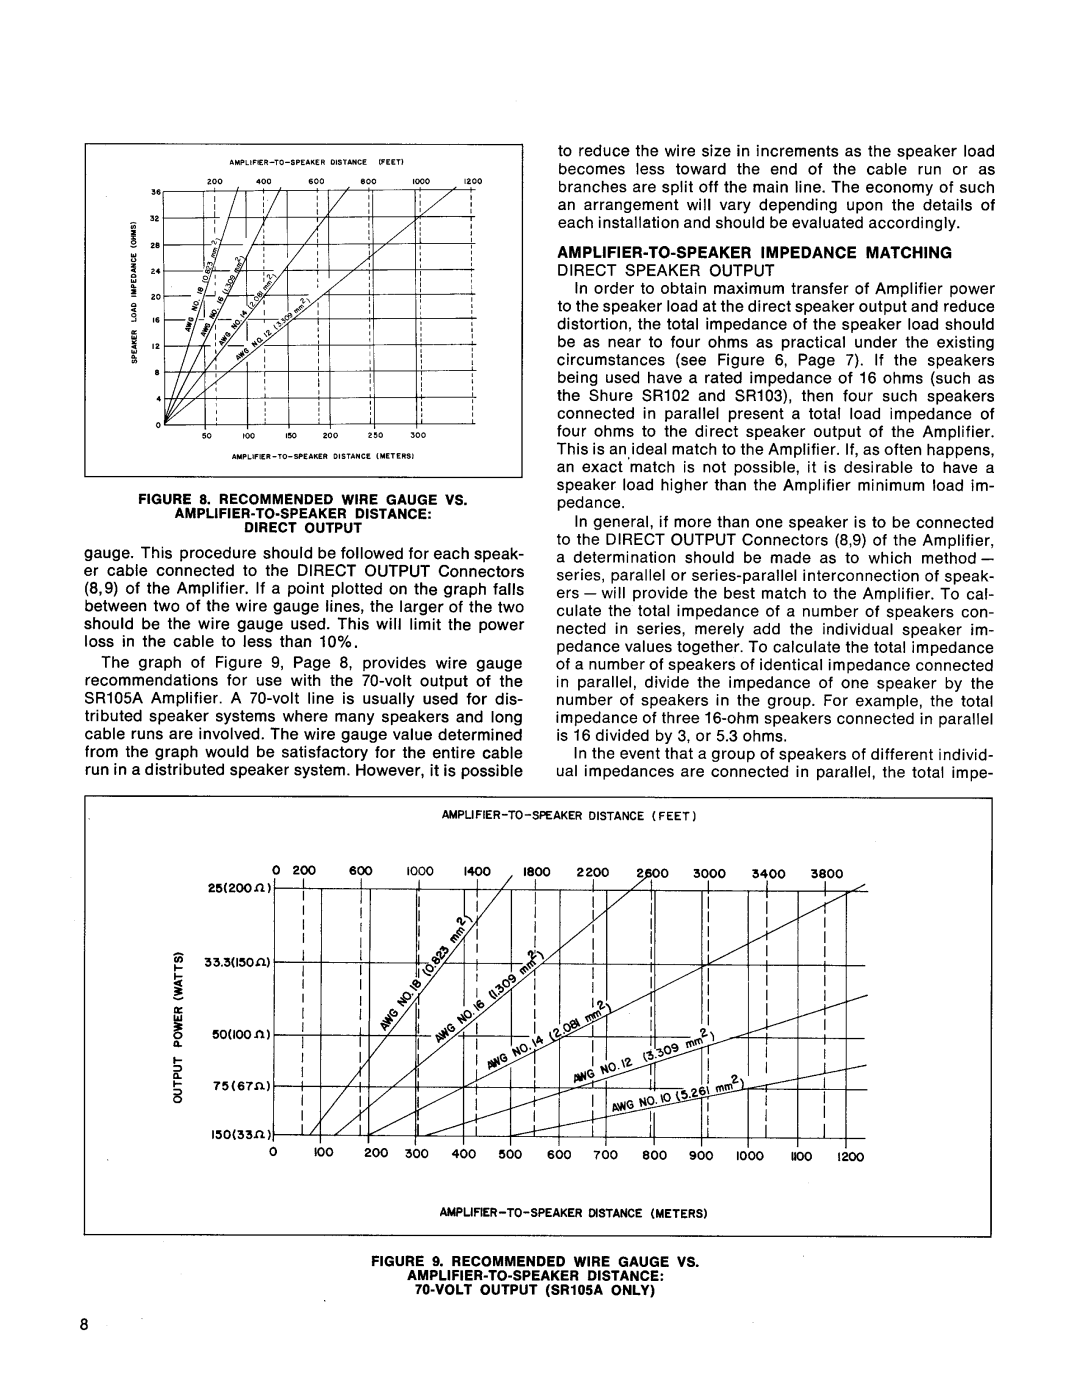
FIGURE 8. RECOMMENDED WIRE GAUGE VS.
AMPLIFIER-TO-SPEAKER DISTANCE:
DIRECT OUTPUT
gauge. This procedure should be followed for each speak- er cable connected to the DIRECT OUTPUT Connectors (8,9) of the Amplifier. If a point plotted on the graph falls between two of the wire gauge lines, the larger of the two should be the wire gauge used. This will limit the power loss in the cable to less than 10%.
The graph of Figure 9, Page 8, provides wire gauge recommendations for use with the
to reduce the wire size in increments as the speaker load becomes less toward the end of the cable run or as branches are split off the main line. The economy of such an arrangement will vary depending upon the details of each installation and should be evaluated accordingly.
In order to obtain maximum transfer of Amplifier power to the speaker load at the direct speaker output and reduce distortion, the total impedance of the speaker load should be as near to four ohms as practical under the existing circumstances (see Figure 6, Page 7). If the speakers being used have a rated impedance of 16 ohms (such as the Shure SR102 and SR103), then four such speakers connected in parallel present a total load impedance of four ohms to the direct speaker output of the Amplifier. This is an,ideal match to the Amplifier. If, as often happens, an exact match is not possible, it is desirable to have a speaker load higher than the Amplifier minimum load im- pedance.
In general, if more than one speaker is to be connected to the DIRECT OUTPUT Connectors (8,9) of the Amplifier, a determination should be made as to which method - series, parallel or
In the event that a group of speakers of different individ- ual impedances are connected in parallel, the total impe-
a
W
0100 200 300 400 500 600 700 800 900 1000 1100 1200
