Activity 4—Bouncing Ball

Notes for Teachers


Concepts

Function explored: parabolic

Real-world concepts such as free-falling and bouncing objects, gravity, and constant acceleration are examples of parabolic functions. This activity investigates the values of height, time, and the coefficient A in the quadratic equation,

Y = A(X – H)2 + K, which describes the behavior of a bouncing ball.

Materials

Ÿcalculator (see page 2 for available models)

ŸCBR 2™ motion detector

Ÿunit-to-CBR 2™ or I/O unit-to-unit cable

ŸEasyData application or RANGER program

Ÿlarge (9-inch) playground ball

ŸTI ViewScreené panel (optional)

Hints

This activity is best performed with two students, one to hold the ball and the other to select Start on the calculator.

See pages 6–9 for hints on effective data collection.

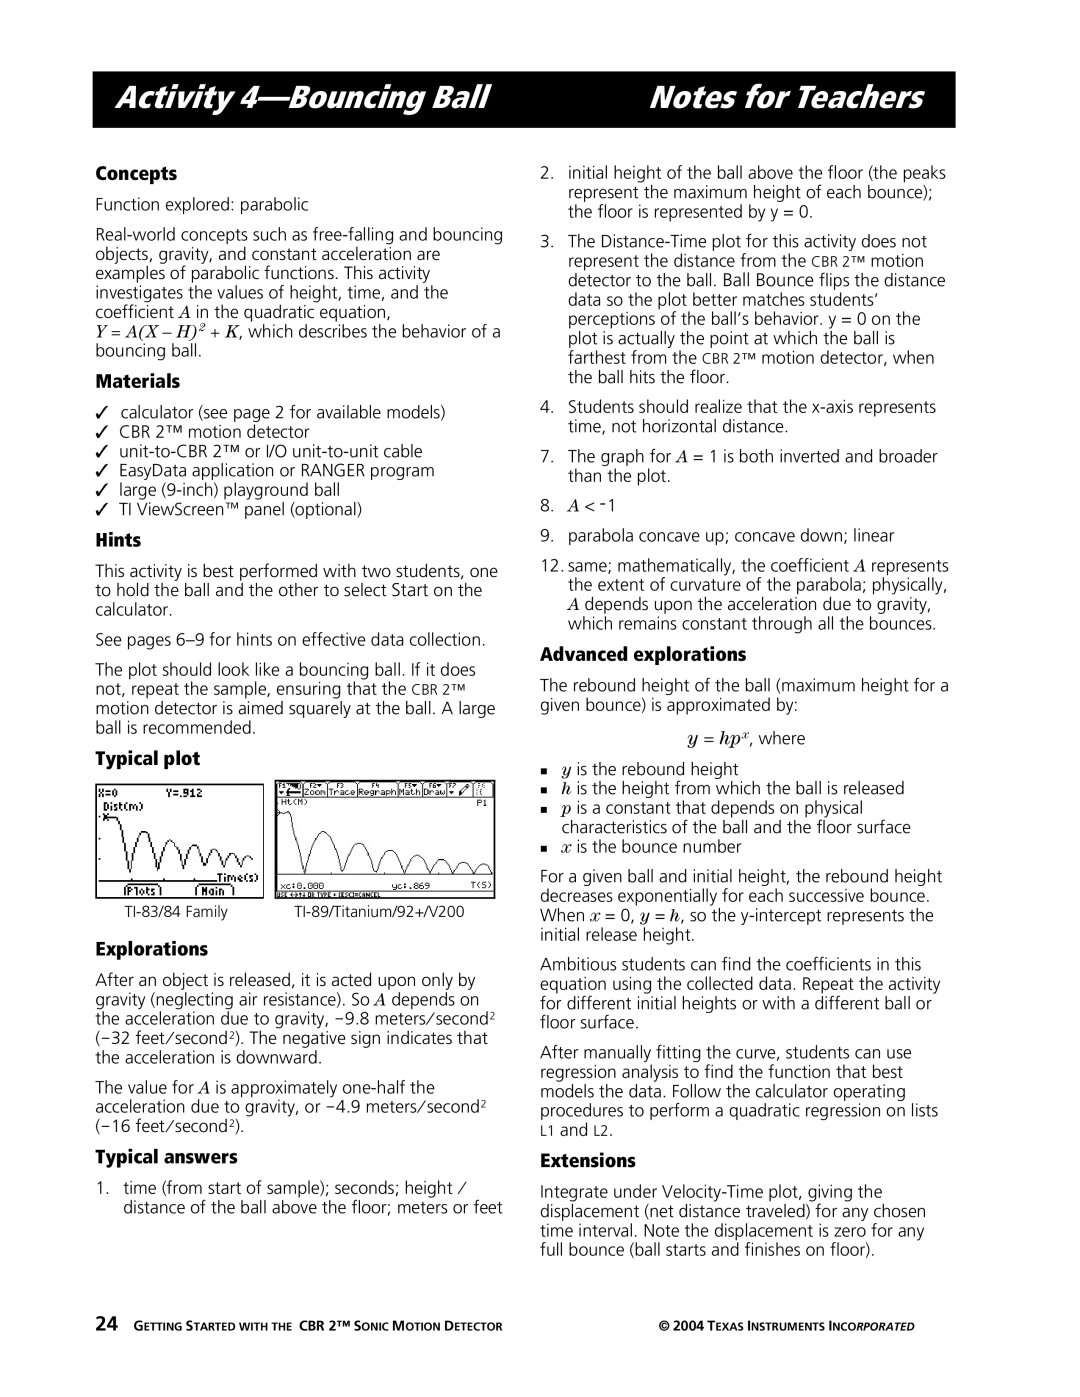
The plot should look like a bouncing ball. If it does not, repeat the sample, ensuring that the CBR 2™ motion detector is aimed squarely at the ball. A large ball is recommended.

Typical plot

TI-83/84 Family

TI-89/Titanium/92+/V200

Explorations

After an object is released, it is acted upon only by gravity (neglecting air resistance). So A depends on the acceleration due to gravity, N9.8 metersàsecond2 (N32 feetàsecond2). The negative sign indicates that the acceleration is downward.

The value for A is approximately one-half the acceleration due to gravity, or N4.9 metersàsecond2 (N16 feetàsecond2).

Typical answers

1.time (from start of sample); seconds; height à distance of the ball above the floor; meters or feet

24 GETTING STARTED WITH THE CBR 2™ SONIC MOTION DETECTOR

2.initial height of the ball above the floor (the peaks represent the maximum height of each bounce); the floor is represented by y = 0.

3.The Distance-Time plot for this activity does not represent the distance from the CBR 2™ motion detector to the ball. Ball Bounce flips the distance data so the plot better matches students’ perceptions of the ball’s behavior. y = 0 on the plot is actually the point at which the ball is farthest from the CBR 2™ motion detector, when the ball hits the floor.

4.Students should realize that the x-axis represents time, not horizontal distance.

7.The graph for A = 1 is both inverted and broader than the plot.

8.A < L1

9.parabola concave up; concave down; linear

12.same; mathematically, the coefficient A represents the extent of curvature of the parabola; physically, A depends upon the acceleration due to gravity, which remains constant through all the bounces.

Advanced explorations

The rebound height of the ball (maximum height for a given bounce) is approximated by:

y= hpx, where

0y is the rebound height

0h is the height from which the ball is released

0p is a constant that depends on physical characteristics of the ball and the floor surface

0x is the bounce number

For a given ball and initial height, the rebound height decreases exponentially for each successive bounce. When x = 0, y = h, so the y-intercept represents the initial release height.

Ambitious students can find the coefficients in this equation using the collected data. Repeat the activity for different initial heights or with a different ball or floor surface.

After manually fitting the curve, students can use regression analysis to find the function that best models the data. Follow the calculator operating procedures to perform a quadratic regression on lists L1 and L2.

Extensions

Integrate under Velocity-Time plot, giving the displacement (net distance traveled) for any chosen time interval. Note the displacement is zero for any full bounce (ball starts and finishes on floor).

© 2004 TEXAS INSTRUMENTS INCORPORATED

Page 26
Image 26
Texas Instruments CBR 2 manual Activity 4-Bouncing Ball, Explorations, Advanced explorations

CBR 2 specifications

Texas Instruments has long been a prominent player in the field of educational technology, and the CBR 2 (Calculator-Based Ranger 2) is a testament to their commitment to enhancing the learning experience, particularly in the realms of mathematics and science. Designed to complement graphing calculators, the CBR 2 is a versatile data-collection device that empowers students and educators to explore real-world phenomena through hands-on experimentation.

One of the main features of the CBR 2 is its ability to capture a wide array of data through various sensors. The device is equipped with an array of built-in sensors that can measure motion, including speed and distance. This makes it an invaluable tool for physics experiments, allowing students to visualize concepts such as speed, acceleration, and trajectory.

The CBR 2 utilizes ultrasonic technology to detect distance through sound waves. This feature enables students to conduct experiments that demonstrate principles of sound and motion in a tangible way. With a range of up to 6 meters, the CBR 2 provides accurate and reliable measurements that can be graphically represented using compatible Texas Instruments graphing calculators.

The device is highly user-friendly, with simple interfaces that allow users to easily collect and analyze data. The integration with graphing calculators simplifies the process of data visualization, enabling students to create graphs in real time as they conduct experiments. This capability is particularly beneficial in encouraging interactive learning and fostering a deeper understanding of scientific principles.

The CBR 2 is designed to be portable and durable, making it suitable for classroom settings as well as outdoor experiments. Its compact size and lightweight construction ensure that it can be easily transported, allowing educators to take learning beyond the confines of the classroom.

The CBR 2 also supports various modes of data collection, including Event Mode, which allows users to trigger data collection based on specific events. This feature is useful in demonstrating concepts such as projectile motion and collisions, providing students with hands-on experience that enhances their learning.

In summary, Texas Instruments' CBR 2 is a powerful educational tool that enables students to collect, analyze, and visualize data in an engaging manner. With its built-in sensors, ultrasonic technology, and seamless integration with graphing calculators, the CBR 2 stands out as a versatile device that enriches the educational experience. It not only provides a platform for conducting experiments but also cultivates critical thinking skills and a deeper understanding of scientific concepts, preparing students for a future in STEM fields.