SLUU186 − March 2004
6 Test Results / Performance Data
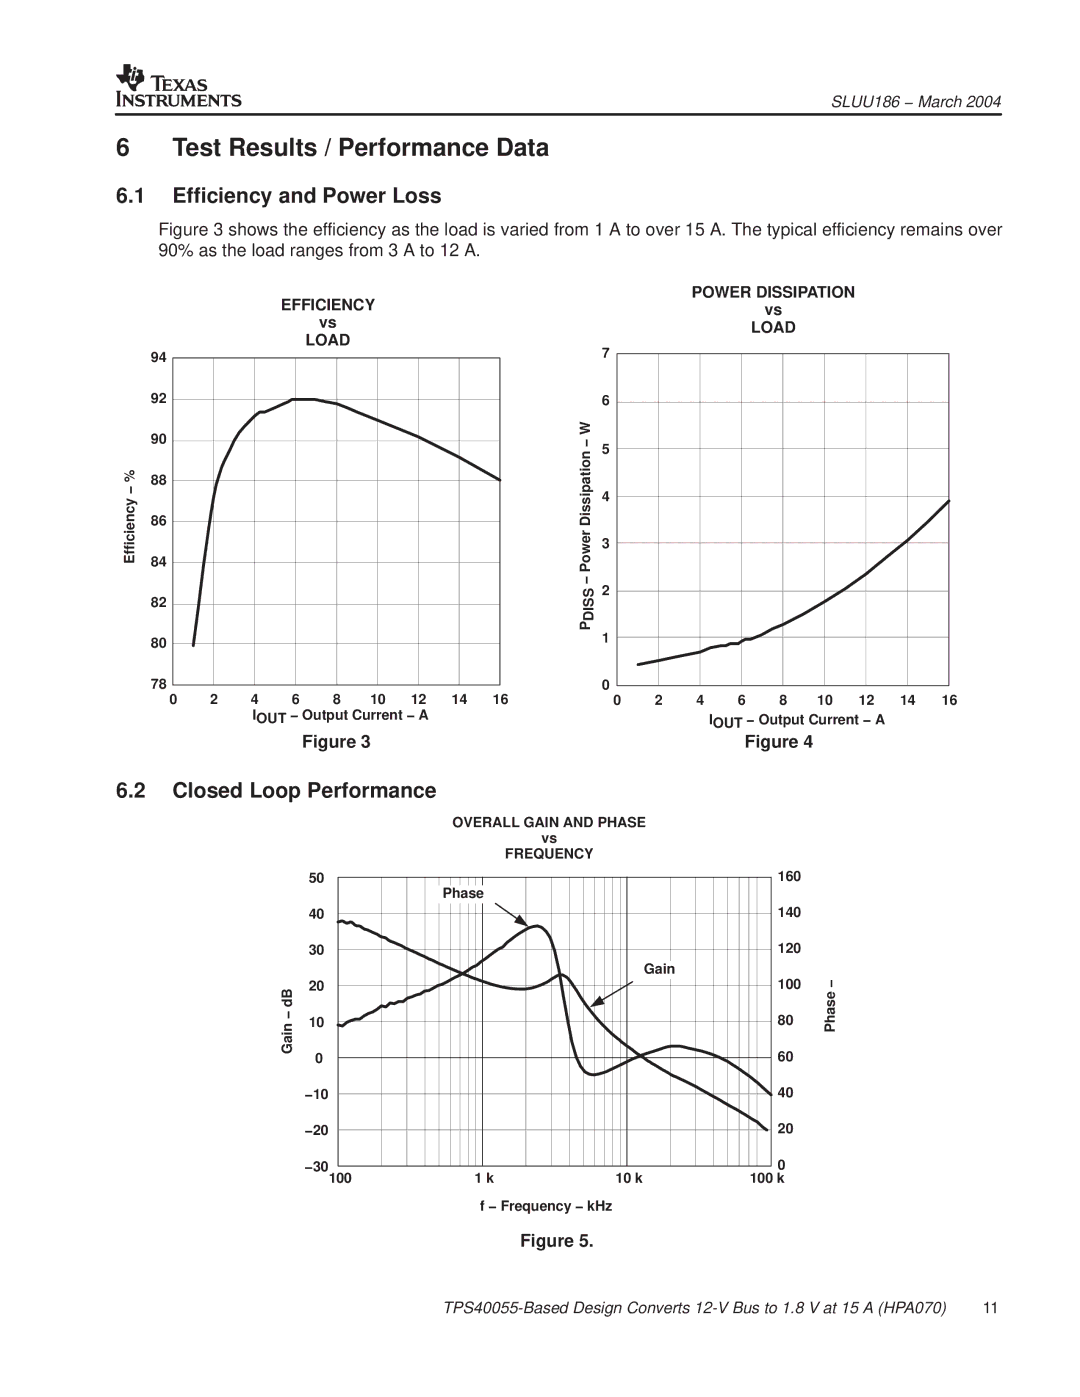
6.1Efficiency and Power Loss
Figure 3 shows the efficiency as the load is varied from 1 A to over 15 A. The typical efficiency remains over 90% as the load ranges from 3 A to 12 A.
|
|
|
| EFFICIENCY |
|
|
| ||
|
|
|
|
| vs |
|
|
|
|
| 94 |
|
|
| LOAD |
|
|
|
|
|
|
|
|
|
|
|
|
| |
| 92 |
|
|
|
|
|
|
|
|
| 90 |
|
|
|
|
|
|
|
|
% | 88 |
|
|
|
|
|
|
|
|
− |
|
|
|
|
|
|
|
|
|
Efficiency | 86 |
|
|
|
|
|
|
|
|
84 |
|
|
|
|
|
|
|
| |
|
|
|
|
|
|
|
|
| |
| 82 |
|
|
|
|
|
|
|
|
| 80 |
|
|
|
|
|
|
|
|
| 78 |
|
|
|
|
|
|
|
|
| 0 | 2 | 4 | 6 | 8 | 10 | 12 | 14 | 16 |
|
|
| IOUT − Output Current − A |
|
| ||||
Figure 3
|
|
| POWER DISSIPATION |
|
|
| |||
|
|
|
|
| vs |
|
|
|
|
|
|
|
|
| LOAD |
|
|
|
|
| 7 |
|
|
|
|
|
|
|
|
| 6 |
|
|
|
|
|
|
|
|
− W | 5 |
|
|
|
|
|
|
|
|
Dissipation |
|
|
|
|
|
|
|
| |
4 |
|
|
|
|
|
|
|
| |
|
|
|
|
|
|
|
|
| |
− Power | 3 |
|
|
|
|
|
|
|
|
2 |
|
|
|
|
|
|
|
| |
DISS |
|
|
|
|
|
|
|
| |
|
|
|
|
|
|
|
|
| |
P | 1 |
|
|
|
|
|
|
|
|
|
|
|
|
|
|
|
|
| |
| 0 |
|
|
|
|
|
|
|
|
| 0 | 2 | 4 | 6 | 8 | 10 | 12 | 14 | 16 |
|
|
|
| IOUT − Output Current − A |
|
| |||
Figure 4
6.2Closed Loop Performance
OVERALL GAIN AND PHASE
vs
FREQUENCY
50 | Phase |
| 160 |
|
|
|
|
| |
40 |
|
| 140 |
|
30 |
|
| 120 |
|
|
| Gain | 100 | ° |
20 |
|
| − | |
|
| Phase | ||
10 |
|
| 80 | |
GaindB− |
|
| 60 | |
0 |
|
|
| |
−10 |
|
| 40 |
|
−20 |
|
| 20 |
|
−30 | 1 k | 10 k | 0 |
|
100 | 100 k |
| ||
| f − Frequency − kHz |
|
|
|
Figure 5.
11 |