SPRAA56
Appendix A. Performance Impact
A.1 Overhead of Performance Measurement Techniques
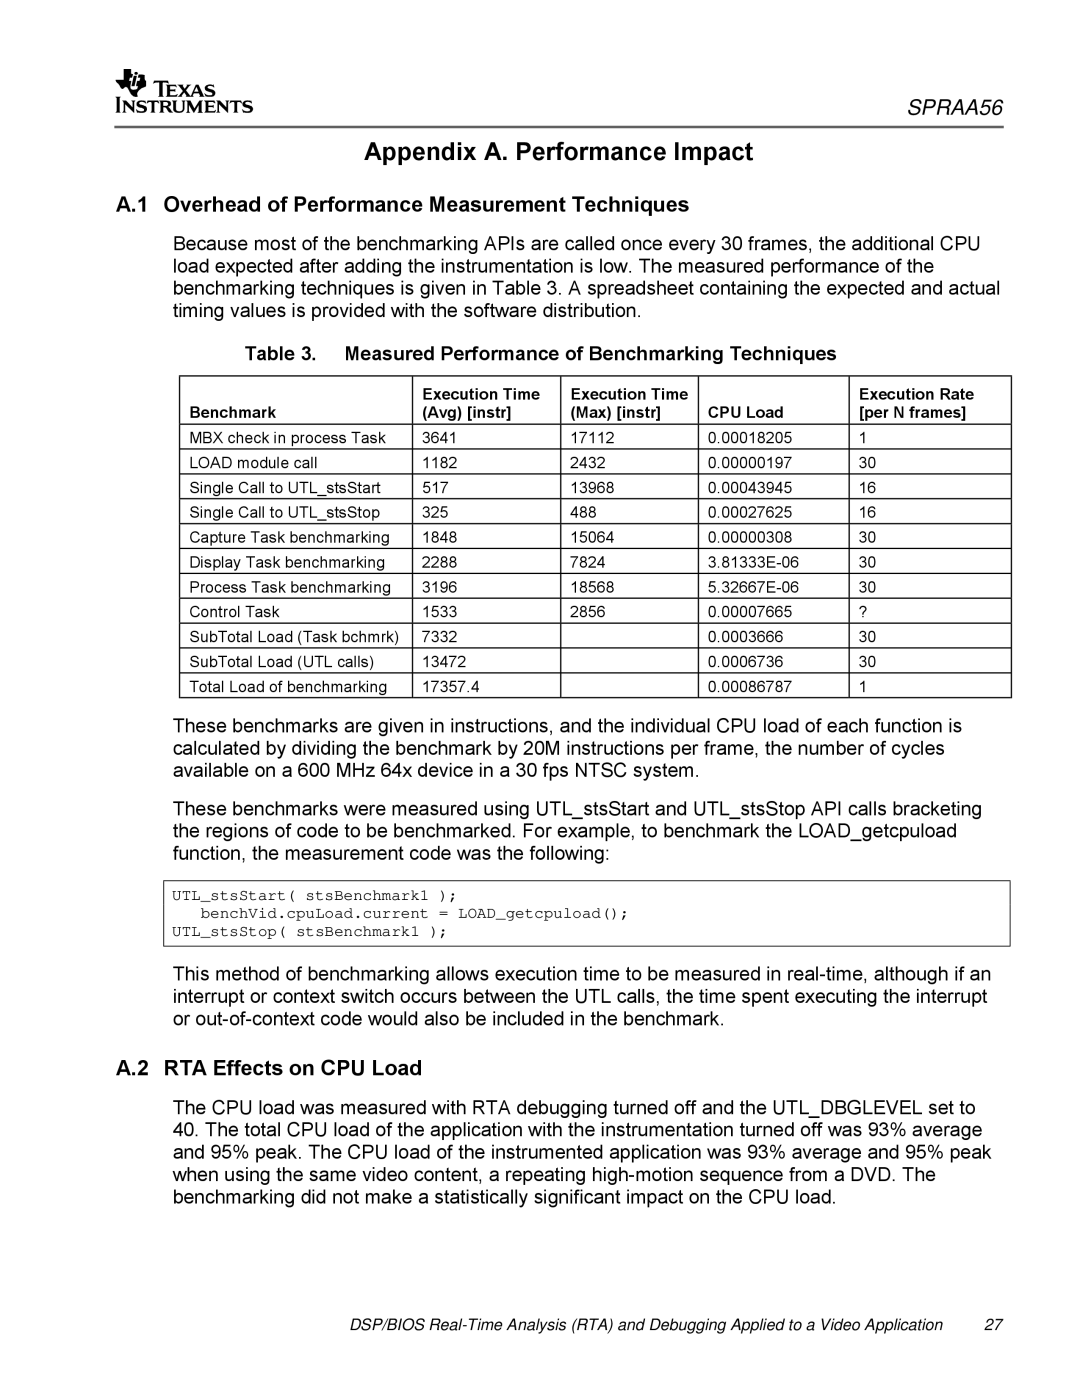
Because most of the benchmarking APIs are called once every 30 frames, the additional CPU load expected after adding the instrumentation is low. The measured performance of the benchmarking techniques is given in Table 3. A spreadsheet containing the expected and actual timing values is provided with the software distribution.
Table 3. Measured Performance of Benchmarking Techniques
| Execution Time | Execution Time |
| Execution Rate |
Benchmark | (Avg) [instr] | (Max) [instr] | CPU Load | [per N frames] |
MBX check in process Task | 3641 | 17112 | 0.00018205 | 1 |
LOAD module call | 1182 | 2432 | 0.00000197 | 30 |
Single Call to UTL_stsStart | 517 | 13968 | 0.00043945 | 16 |
Single Call to UTL_stsStop | 325 | 488 | 0.00027625 | 16 |
Capture Task benchmarking | 1848 | 15064 | 0.00000308 | 30 |
Display Task benchmarking | 2288 | 7824 | 30 | |
Process Task benchmarking | 3196 | 18568 | 30 | |
Control Task | 1533 | 2856 | 0.00007665 | ? |
SubTotal Load (Task bchmrk) | 7332 |
| 0.0003666 | 30 |
SubTotal Load (UTL calls) | 13472 |
| 0.0006736 | 30 |
Total Load of benchmarking | 17357.4 |
| 0.00086787 | 1 |
These benchmarks are given in instructions, and the individual CPU load of each function is calculated by dividing the benchmark by 20M instructions per frame, the number of cycles available on a 600 MHz 64x device in a 30 fps NTSC system.
These benchmarks were measured using UTL_stsStart and UTL_stsStop API calls bracketing the regions of code to be benchmarked. For example, to benchmark the LOAD_getcpuload function, the measurement code was the following:
UTL_stsStart( stsBenchmark1 ); benchVid.cpuLoad.current = LOAD_getcpuload();
UTL_stsStop( stsBenchmark1 );
This method of benchmarking allows execution time to be measured in
A.2 RTA Effects on CPU Load
The CPU load was measured with RTA debugging turned off and the UTL_DBGLEVEL set to
40.The total CPU load of the application with the instrumentation turned off was 93% average and 95% peak. The CPU load of the instrumented application was 93% average and 95% peak when using the same video content, a repeating
DSP/BIOS | 27 |
