INTERPRETING THE DISPLAY
3.1 Zero Line
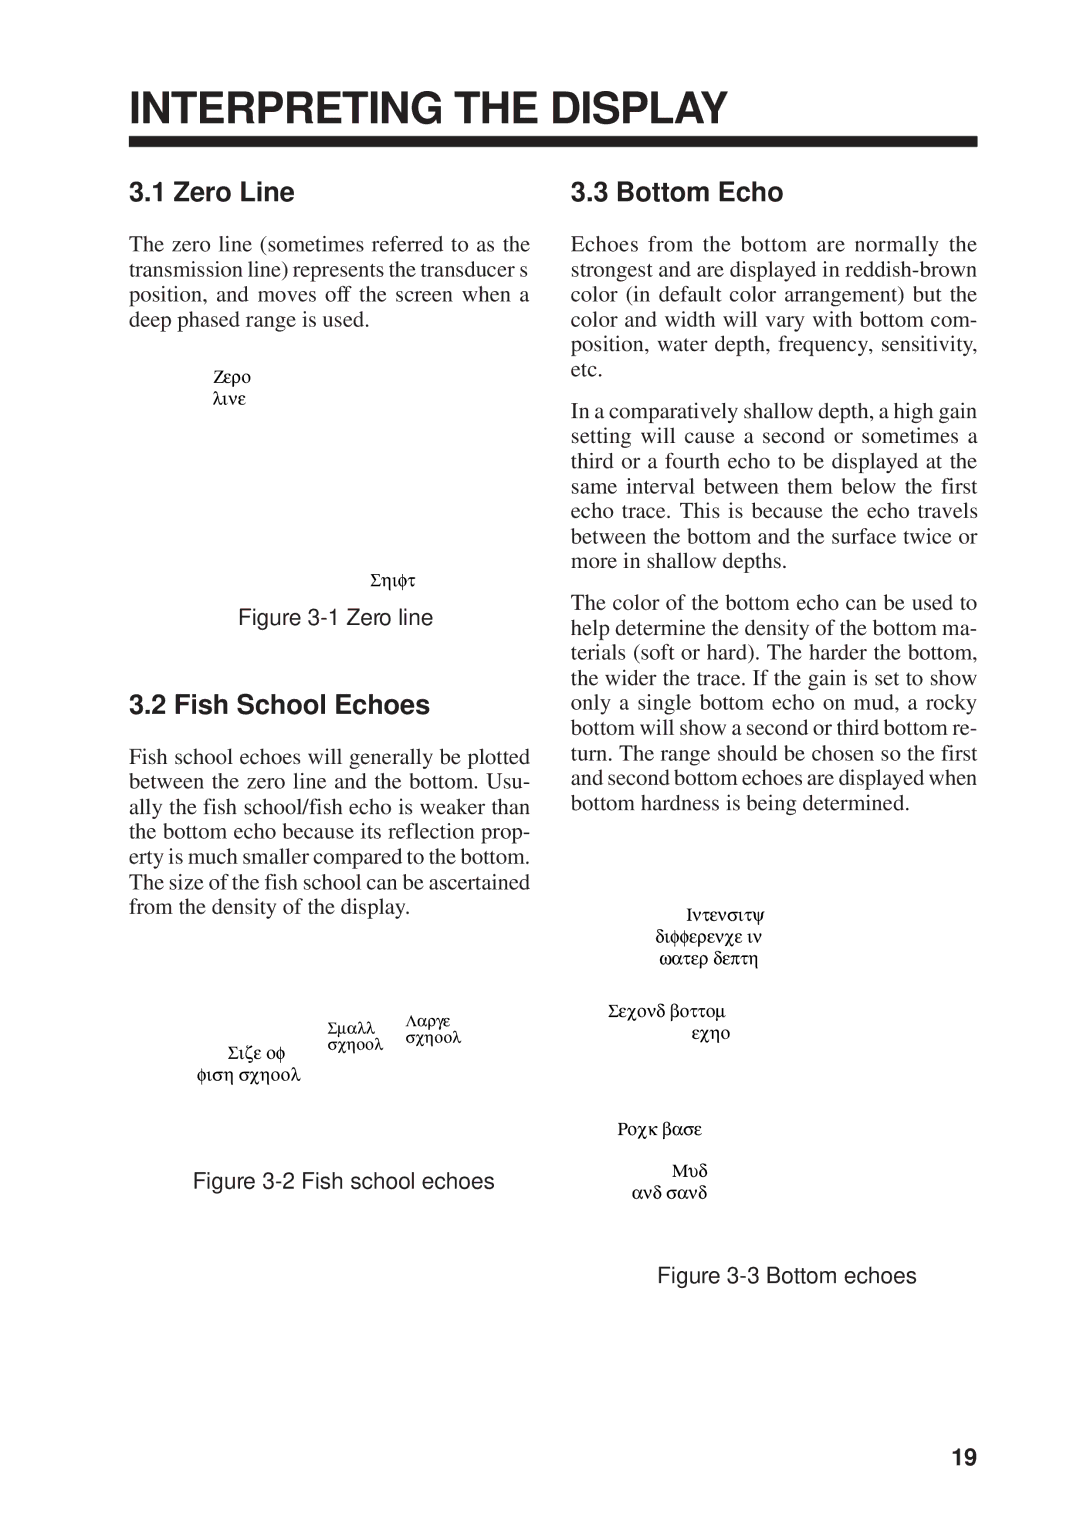
The zero line (sometimes referred to as the transmission line) represents the transducer’s position, and moves off the screen when a deep phased range is used.
Zero line
Shift
Figure 3-1 Zero line
3.2 Fish School Echoes
Fish school echoes will generally be plotted between the zero line and the bottom. Usu- ally the fish school/fish echo is weaker than the bottom echo because its reflection prop- erty is much smaller compared to the bottom. The size of the fish school can be ascertained from the density of the display.
3.3 Bottom Echo
Echoes from the bottom are normally the strongest and are displayed in
In a comparatively shallow depth, a high gain setting will cause a second or sometimes a third or a fourth echo to be displayed at the same interval between them below the first echo trace. This is because the echo travels between the bottom and the surface twice or more in shallow depths.
The color of the bottom echo can be used to help determine the density of the bottom ma- terials (soft or hard). The harder the bottom, the wider the trace. If the gain is set to show only a single bottom echo on mud, a rocky bottom will show a second or third bottom re- turn. The range should be chosen so the first and second bottom echoes are displayed when bottom hardness is being determined.
Intensity difference in water depth
Size of fish school
Small Large school school
Second bottom echo
Rock base
Figure 3-2 Fish school echoes
Mud and sand
Figure 3-3 Bottom echoes
19