HP Part Number NW238-90001 Edition 1, December
Legal Notice
HP 20b Business Consultant
HP 30b Business Professional
Functions and Math Math
On/Off/Cancel
Line, alphanumeric scrolling Common Mathematical
Program menu
Page
Table of Contents
Canadian Mortgage Example
Cash Flow Example Sample Cash Flow Diagrams Bonds Bond Menu
Amortization Interest Conversion Menu
Black-Scholes Menu
Welcome to your new HP Financial Calculator
Basic Features
Adjusting the Display Contrast
Turning the Calculator On and Off
Cursor
Mode Menu Setting Preferences
Two Line Display
Dd.mmyyyy
Changing the Calculation Mode
Primary, Secondary, and Tertiary Key Functions
Input Key
Using the Input and Equals Keys
Annunciators
Equals Key
Reset Menu
Editing and Clearing Entries On/CE Key
Accessing Menus and Menu Maps
Memory and the Memory Menu
Basic Features
Fixed Cost Price Profit Quantity
DWN
Number Entry and Display
Mathematical Calculations
Mathematical Functions
Mathematical functions are located
Chain Mode
Algebraic Mode
RPN Stack
Reverse Polish Notation RPN Mode
Ior =, followed by an operation key
See -2for an example using the last number function
Last Number
O1c23 I56c
U3I
+ 4 x 5 +
3I4
5I6
Duplicating a Number on the Stack
One-Number Functions and the Math Menu
RPN Stack and the Swap Operation
Random number
Math Menu
DWN
Probability Sub-menu
10I
12I
Binomial Functions
15I3h
Two-Number Functions
Recall Arithmetic
Storing and Recalling Numbers
Storing and Recalling with Time Value of Money TVM Keys
Rounding Numbers
Recalling a Menu Item Value in a Menu
Percentages
Mathematical Calculations
Time Value of Money
Time Value of Money TVM Keys
Calculating Payments on a Loan
Stores or calculates the amount of each periodic payment
1400 00V
360N
Amortization
Nb Per Start Balance
Principal Interest
10Y
Creating an Amortization Schedule
Amortization Example KeysDisplayDescription
Interest Conversion Menu
To open the Interest Conversion menu IConv press
Using the Interest Conversion Menu
360
Canadian Mortgages TVM Canada
DWN
O300 N6Y35 0000
Canadian Mortgage Example
Cash Flows
000.00
Cash Flow Example
4500
8000
5000
4000
1150
00I
Analyzing Cash Flows
Mirr
Inv. I% Safe I%
DWN Mirr Fmrr
Opens the NPV menu
Editing Cash Flows
Displays FMRR%
Sample Cash Flow Diagrams
Sample Cash Flow Diagrams Cash Flows
Bonds
Set.Date Mat.Date
Bond Menu
CPN%
42020
82010
Bond Calculation Example
=L1+
Stock price Strike price Time to maturity Risk-free %
Black-Scholes Calculation Menu
Volatility % Dividend % Call price Put price
Black-Scholes Menu
Volatility % input
Black-Scholes Example
78I
80I
85I
72I
Press to scroll to
Date Calculation Example
Date Calculation
Date Calculation Menu
Date Days Between Actual Cal.360
2010
3120 10I
Break-even Menu
Break-even
Break-even Example
300
1500 00I
250
100 00I
Business Problems
Percent Calculation Menu
15I
Percent Calculation Examples
20I
80I
Is what % of 80?
Press Ito scroll through the options Sline
Depreciation
Book Value Depreciable
Depreciation Menu
Soyd
00I 500
100
Depreciation Example
Depreciation
Statistical Operations
Ax2+bx+c only
Data and Stats Menus
Statistics Menu Items Description Std. Dev
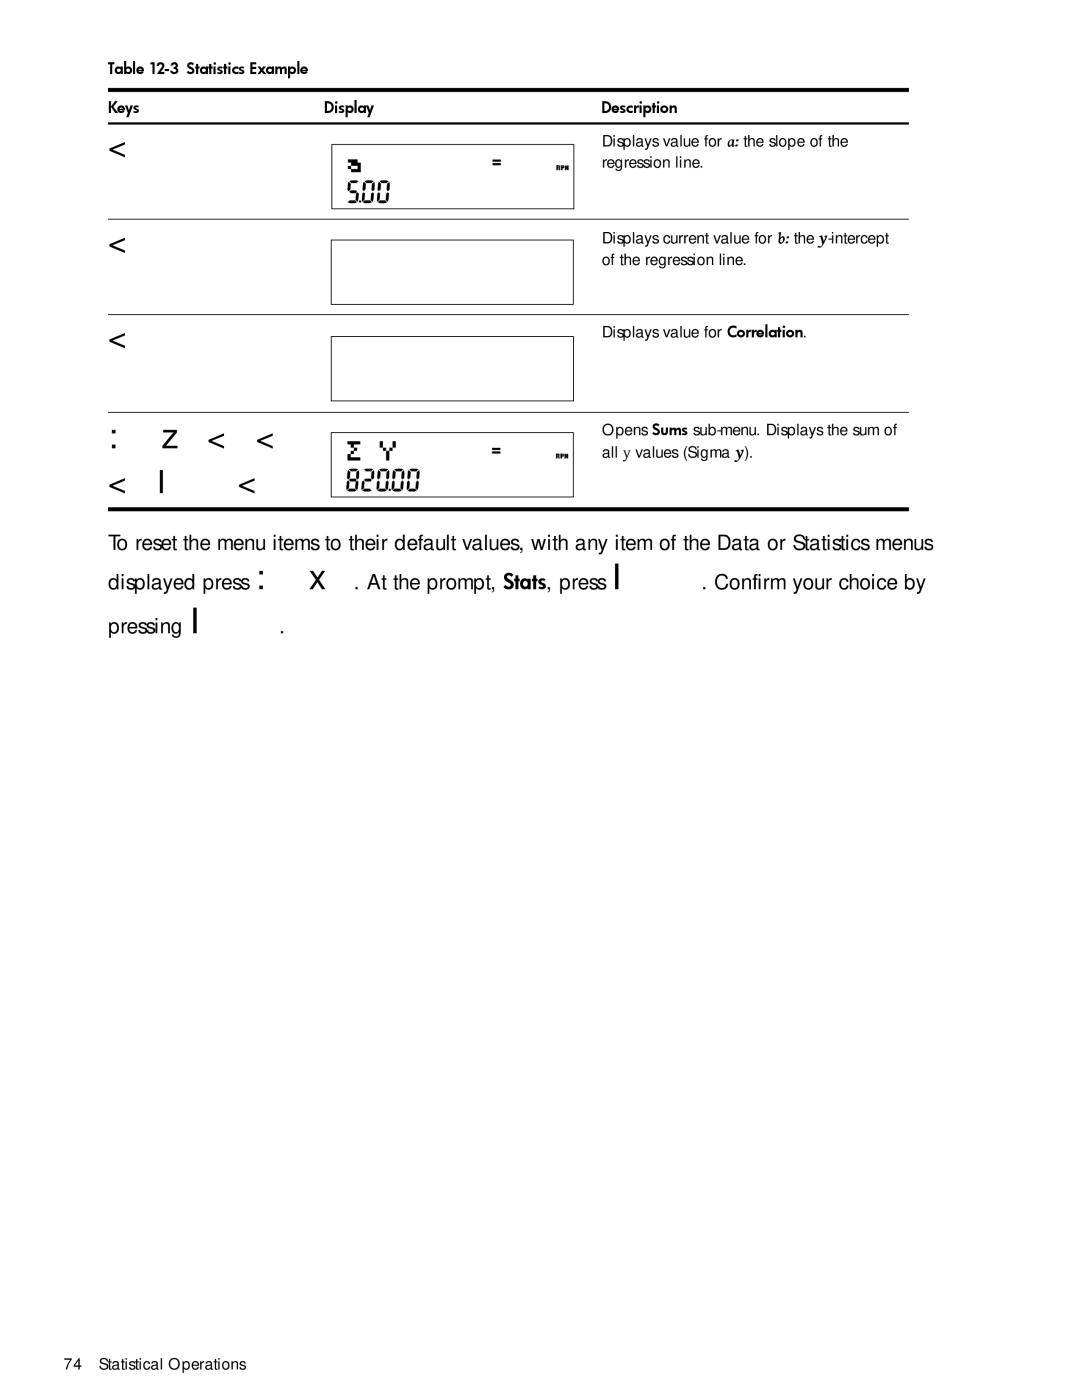
Statistics Example
3I1 60I
1I1 50I
2I1 65I
4I1 75I
Statistical Operations
Programming the HP 30b
Programming
Key Presses for Program Instructions
Hold
Programming Example
Hold
Program Step
Reassigning Menu Functions
Followed by a label number to go
Program Menu and Program Editing
To a specific label
Creates label 03 in your program. You can
Tests and Jump Functions
Use the following keystrokes to enter the program
Long Programs and Battery Life
Sub-Function Call
DSE
05003$1
Other Programming Functions
ISG , followed by 1 digit
Messages
Calculates the volume
Debugging a Program
Saving, Restoring, and Modifying Mode Settings
L1hL1-L2= Hold
Solve
Programming
Error Messages
Error Messages and Calculator Status
Error Messages Status ER Unique solution to IRR Not Found
Replacing the Batteries
Warranty, Regulatory, and Contact Information
HP Limited Hardware Warranty and Customer Care
General Terms
Warranty, Regulatory, and Contact Information
Avis Canadien
Modifications
Canadian Notice
European Union Regulatory Notice
Low Voltage Directive 2006/95/EC EMC Directive 2004/108/EC
Perchlorate Material special handling may apply
Contact Information
Customer Care
香港特別行政區
Martinica
08 5199
Country/Region Contact Vietnam +65-6272-5300 Viêt Nam Zambia
Warranty, Regulatory, and Contact Information
Symbols
Checksum 78 Combinations Date
Calendar
Cash flow
Debugging 85 Decimal
Key presses Keyboard map and legend Language
Insert and delete keys Interest Conversion
Internal rate of return Investment Rate Key
Margin
Percent Calculation
Math
On HP 30b Parentheses
Percentages Permutations
RPN
Stop 83 Store
Thousands separator Time Value of Money