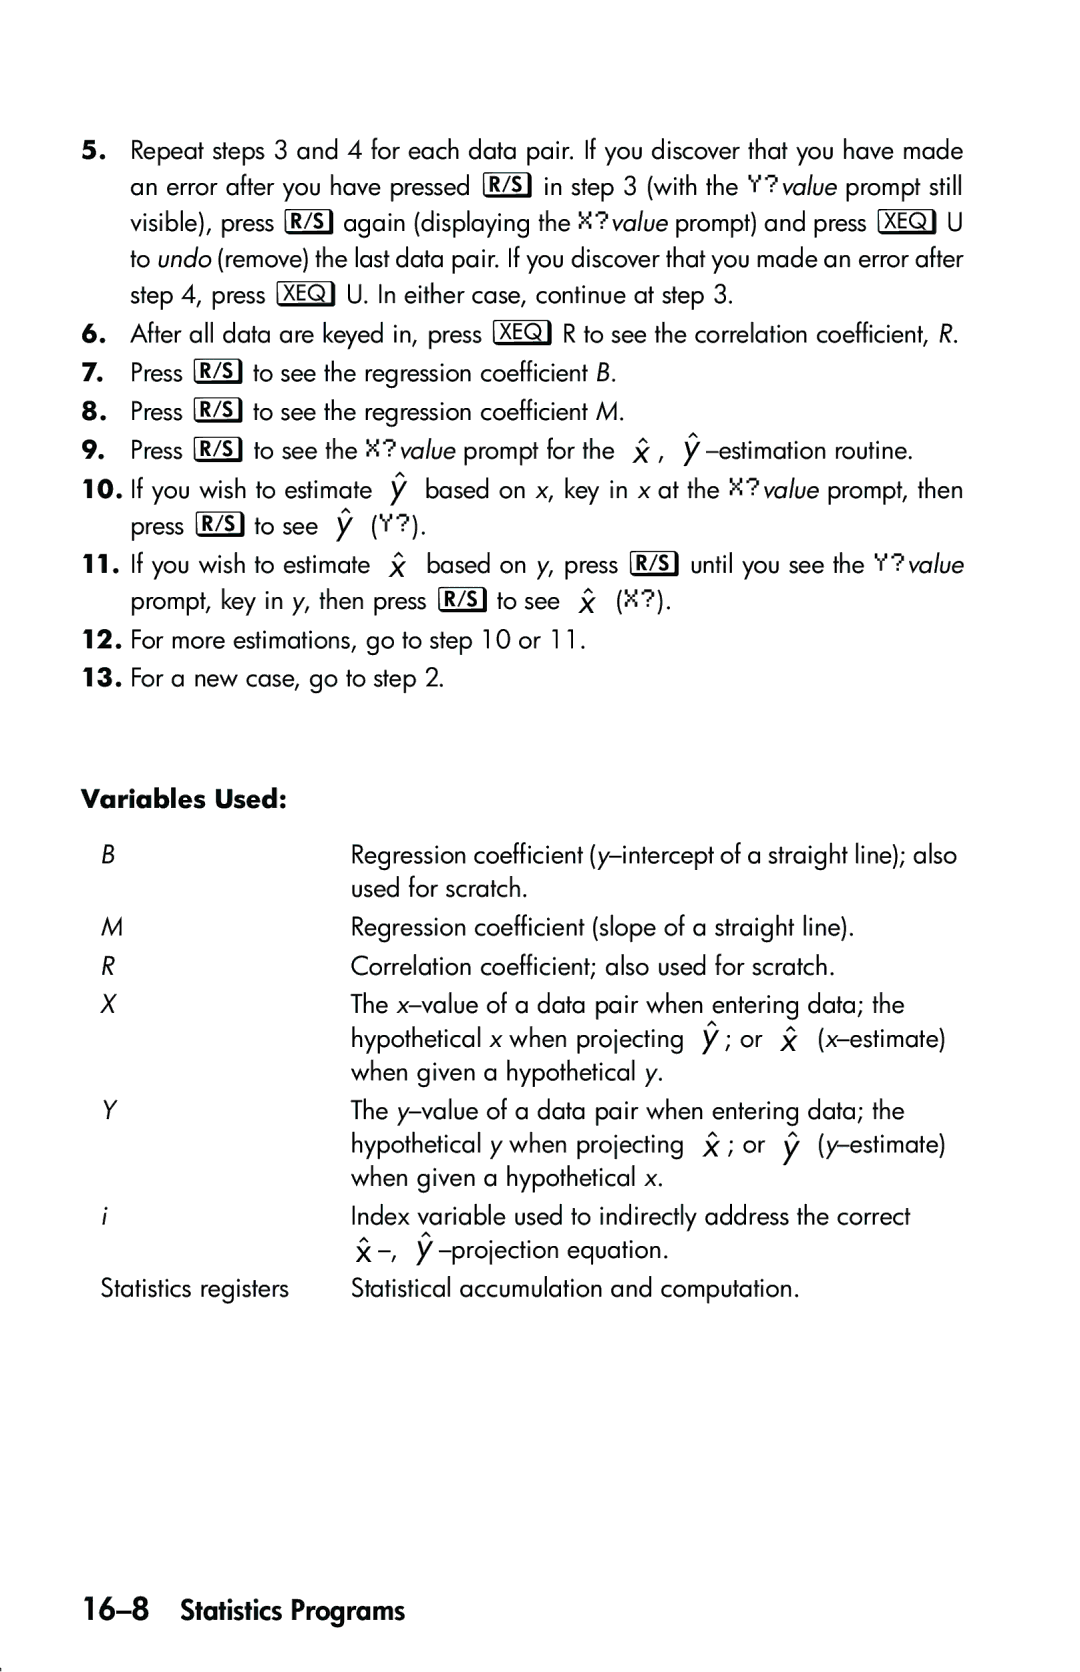
5.Repeat steps 3 and 4 for each data pair. If you discover that you have made an error after you have pressed gin step 3 (with the &@value prompt still visible), press gagain (displaying the %@value prompt) and press XU to undo (remove) the last data pair. If you discover that you made an error after step 4, press XU. In either case, continue at step 3.
6.After all data are keyed in, press XR to see the correlation coefficient, R.
7.Press gto see the regression coefficient B.
8.Press gto see the regression coefficient M.
9.Press gto see the %@value prompt for the xˆ , yˆ
10.If you wish to estimate yˆ based on x, key in x at the %@value prompt, then press gto see yˆ (&@).
11.If you wish to estimate xˆ based on y, press guntil you see the &@value prompt, key in y, then press gto see xˆ (%@).
12.For more estimations, go to step 10 or 11.
13.For a new case, go to step 2.
Variables Used: |
|
B | Regression coefficient |
| used for scratch. |
M | Regression coefficient (slope of a straight line). |
R | Correlation coefficient; also used for scratch. |
X | The |
| hypothetical x when projecting yˆ ; or xˆ |
| when given a hypothetical y. |
Y | The |
| hypothetical y when projecting xˆ ; or yˆ |
| when given a hypothetical x. |
i | Index variable used to indirectly address the correct |
Statistics registers | xˆ |
Statistical accumulation and computation. |
