| Logarithmic | Exponential | Power |
|
|
|
|
To start: | XL | XE | XP |
|
|
|
|
R | 0.9965 | 0.9945 | 0.9959 |
M | 51.1312 | 8.9730 | |
B | 65.8446 | 0.0177 | 0.6640 |
Y ( yˆ when X=37) | 98.7508 | 98.5870 | 98.6845 |
X ( xˆ when Y=101) | 38.2857 | 38.3628 | 38.3151 |
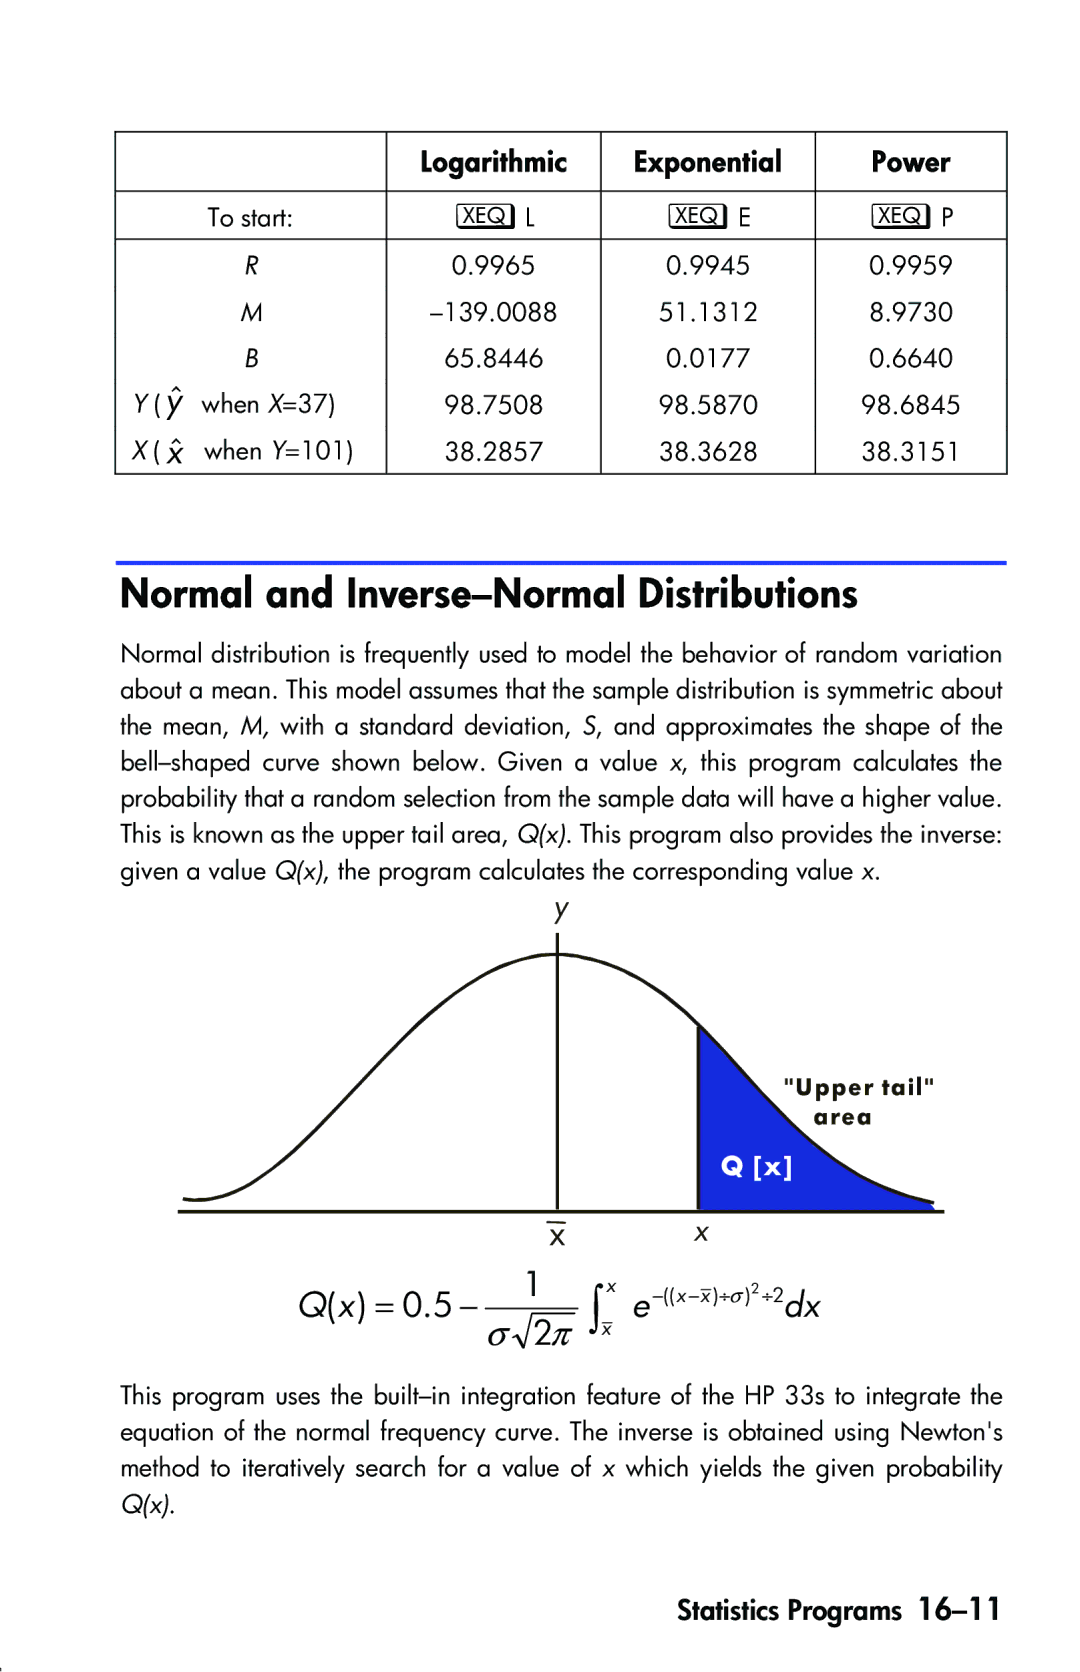
Normal and Inverse–Normal Distributions
Normal distribution is frequently used to model the behavior of random variation about a mean. This model assumes that the sample distribution is symmetric about the mean, M, with a standard deviation, S, and approximates the shape of the
y
"Upper tail" area
Q [x]
x x
Q(x) = 0.5 − σ 12π ≥xx e −((x −x )⎟σ )2 ⎟2dx
This program uses the