HP 50g graphing calculator
User’s manual
Printing History
Preface
Table of Contents
Calculations with real numbers
Calculations with complex numbers
Algebraic and arithmetic operations
Solution to equations
Operations with lists
Vectors
Matrices and linear algebra
Graphics
Calculus Applications
Multi-variateCalculus Applications
Vector Analysis Applications
Differential Equations
Probability Distributions
Using SD cards
Statistical Applications
Numbers in Different Bases
Equation Library
Batteries
Chapter Getting started
Basic Operations
Page
Tool menu
Contents of the calculator’s display
Menus
Setting time and date
Introducing the calculator’s keyboard
ALPHA-Left-Shift function, to enter the lower-case letter p
Selecting calculator modes
Operating Mode
√ 3.*5.-1/3.*3./23.3+EXP2.5
Page
Lets try now the expression proposed earlier
Fixed format with decimals
Number Format and decimal dot or comma
Standard format
Scientific format
Engineering format
Decimal comma vs. decimal point
Angle Measure
Coordinate System
Selecting CAS settings
Explanation of CAS settings
Selecting Display modes
Selecting the display font
Selecting properties of the line editor
Selecting properties of the Stack
References
Selecting properties of the equation writer EQW
Chapter Introducing the calculator
Calculator objects
Editing expressions in the stack
Creating arithmetic expressions
Page
Page
Creating algebraic expressions
2L 1 + + 2 L + y
Using the Equation Writer EQW to create expressions
+ 2 ⋅ 5 +
⎛ x + 2 ∝ ⋅ ∆y ⎞
Organizing data in the calculator
Home directory
Typing variable names
Variables
Subdirectories
Algebraic mode
Creating variables
RPN mode
Page
Checking variables contents
Deleting variables
Listing the contents of all variables in the screen
Using function Purge in the stack in Algebraic mode
Using function Purge in the stack in RPN mode
Undo and CMD functions
Choose boxes vs. Soft Menu
@@OK@@
References
Chapter Calculations with real numbers
Examples of real number calculations
Page
Using powers of 10 in entering data
Page
Hyperbolic functions and their inverses
Using calculator menus
Real number functions in the MTH menu
Page
Operations with units
Units menu
Page
Available units
Attaching units to numbers
Unit prefixes
Operations with units
Unit conversions
Physical constants in the calculator
Quit
Page
Defining and using functions
Reference
Definitions
Setting the calculator to Complex mode
Chapter Calculations with complex numbers
Entering complex numbers
Polar representation of a complex number
Cmplx menu through the MTH menu
Simple operations with complex numbers
Cmplx menus
Forms the complex number x,y out of real numbers x
Functions applied to complex numbers
Cmplx menu in keyboard
Function Droite equation of a straight line
Page
Chapter Algebraic and arithmetic operations
Entering algebraic objects
Simple operations with algebraic objects
Functions in the ALG menu
Collect
Expansion and factoring using log-exp functions
Operations with transcendental functions
Expansion and factoring using trigonometric functions
Functions in the Arithmetic menu
FACTORSSIMP2
Polynomials
Horner function
Variable
Pcoef function
Fractions
Proot function
Quot and Remainder functions
Peval function
SIMP2 function
Propfrac function
Partfrac function
Fcoef function
− 5X 2 + 3X −
Step-by-step operations with polynomials and fractions
Froots function
Reference
Function Isol
Chapter Solution to equations
Symbolic solution of algebraic equations
Function Solve
Page
Function Solvevx
Function Zeros
Numerical solver menu
Finding the solutions to a polynomial equation
Polynomial Equations
Enter vector of roots
Financial calculations
Generating an algebraic expression for the polynomial
Solving equations with one unknown through
Function Steq
Solution to simultaneous equations with Mslv
Reference
Page
Chapter Operations with lists
Creating and storing lists
Operations with lists of numbers
Changing sign
Addition, subtraction, multiplication, division
Page
Lists of complex numbers
Functions applied to lists
Lists of algebraic objects
MTH/LIST menu
Page
SEQ function
MAP function
Page
Typing vectors in the stack
Chapter Vectors
Entering vectors
Storing vectors into variables in the stack
Using the Matrix Writer Mtrw to enter vectors
Moving to the right vs. moving down in the Matrix Writer
Press @GOTO@ 3@@OK@@ 3@@OK@@ @@OK@@ to move to position 3,3
Simple operations with vectors
Addition, subtraction
Absolute value function
MTH/VECTOR menu
Multiplication by a scalar, and division by a scalar
Cross product
Magnitude
Dot product
Reference
Entering matrices in the stack
Using the Matrix Writer
Chapter Matrices and linear algebra
Typing in the matrix directly into the stack
Operations with matrices
Multiplication by a scalar
Addition and subtraction
Multiplication
Cij = ∑aik ⋅ bkj , for i = 1,2,K, m j = 1,2,K, n
Matrix-vector multiplication
Matrix multiplication
Raising a matrix to a real power
Term-by-term multiplication
Identity matrix
Inverse matrix
Characterizing a matrix The matrix Norm menu
Function DET
Function Trace
TrA = ∑aii
Solution of linear systems
Using the numerical solver for linear systems
= ⎢1
⎢x2
Solution with the inverse matrix
Solution by division of matrices
References
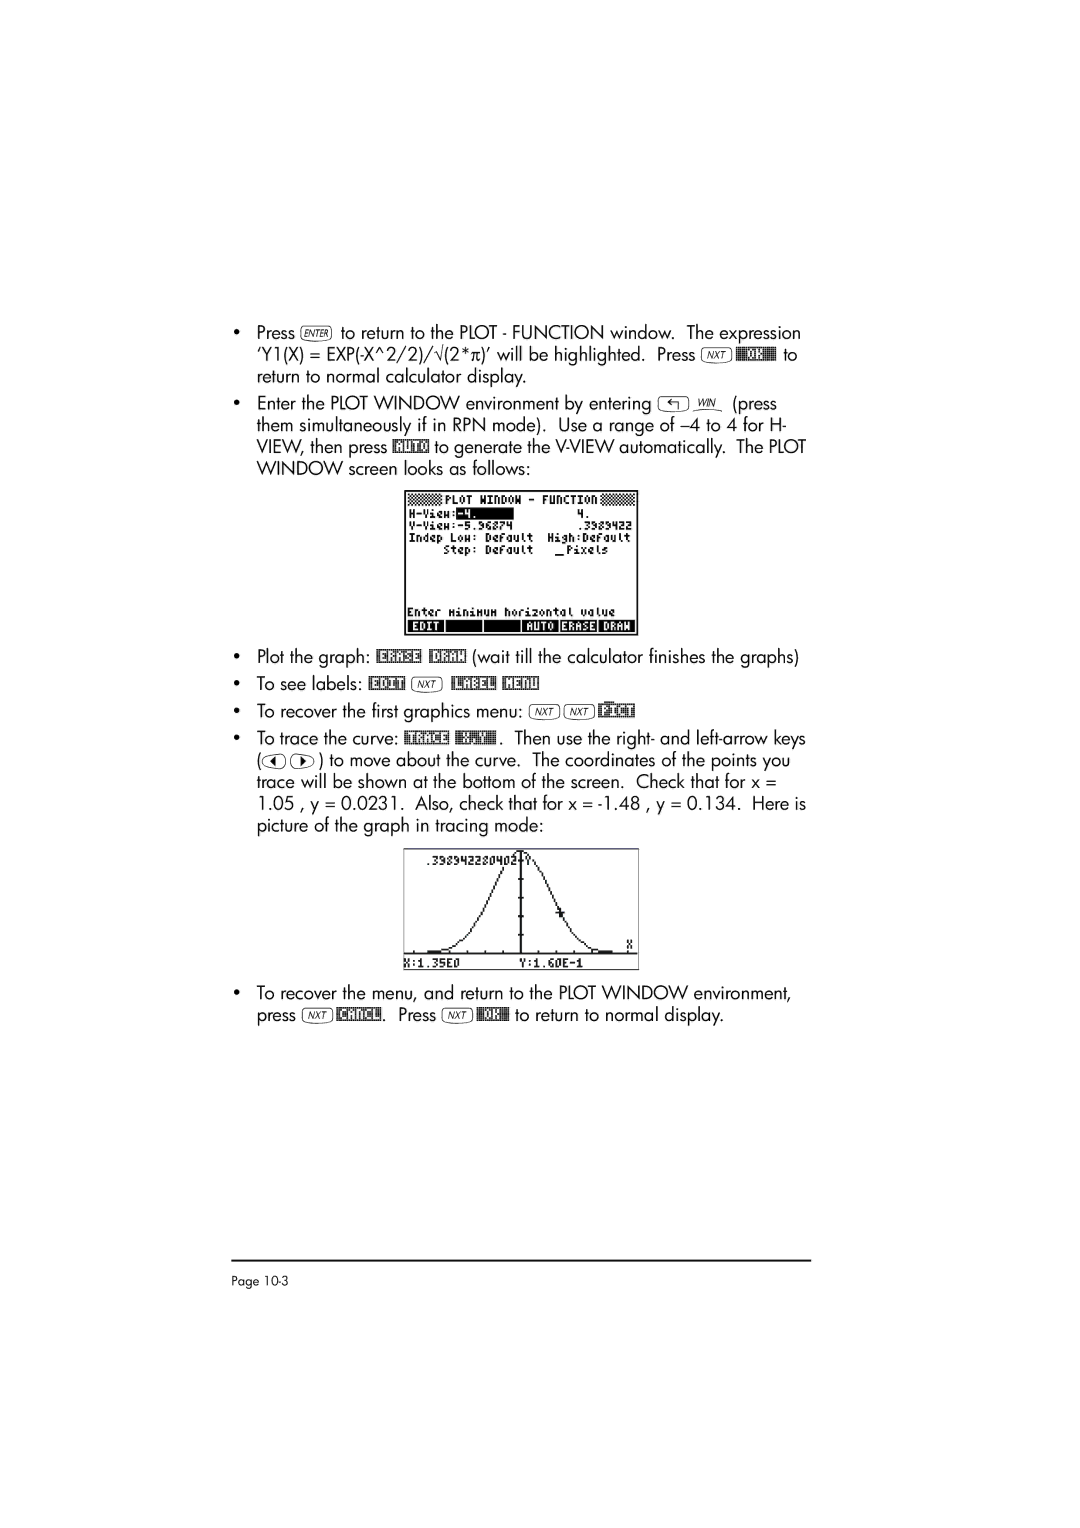
Chapter Graphics
Graphs options in the calculator
Plotting an expression of the form y = fx
= 1 exp− x
Page
Generating a table of values for a function
Fast 3D plots
Keep the default plot window ranges to read
Reference
Page
Chapter Calculus Applications
Calc Calculus menu
Limits and derivatives
Function lim
Lim f
Anti-derivatives and integrals
Functions Deriv and Dervx
Functions INT, INTVX, RISCH, Sigma and Sigmavx
Xdx = F x + C
Definite integrals
= ∑
Infinite series
Functions TAYLR, TAYLR0, and Series
Reference
Chapter Multi-variate Calculus Applications
Partial derivatives
Multiple integrals
Gradient
Chapter Vector Analysis Applications
Del operator
Divergence
Curl
Solution to linear and non-linear equations
Chapter Differential Equations
CALC/DIFF menu
Function Ldec
Page
Function Desolve
Variable Odetype
Laplace Transforms
Laplace transform and inverses in the calculator
Fourier series
Function Fourier
Lf t= F s = 0∞ f t ⋅ e− st dt
2inπt
Fourier series for a quadratic function
Reference
Page
Chapter Probability Distributions
MTH/PROBABILITY.. sub-menu part
Factorials, combinations, and permutations
− r +
Random numbers
Student-t distribution
MTH/PROB menu part
Normal distribution
Chi-square distribution
F distribution
Chapter Statistical Applications
Entering data
Calculating single-variable statistics
Sample vs. population
Obtaining frequency distributions
Page
Fitting data to a function y = fx
195238095238 + 2.00857242857*X Correlation Covariance
Obtaining additional summary statistics
Confidence intervals
Page
Hypothesis testing
Page
Reference
Page
Chapter Numbers in Different Bases
Base menu
Writing non-decimal numbers
Formatting an SD card
Chapter Using SD cards
Inserting and removing an SD card
Accessing objects on an SD card
Storing objects on the SD card
Recalling an object from the SD card
Purging an object from the SD card
Purging all objects on the SD card by reformatting
Specifying a directory on an SD card
Chapter Equation Library
`#EQLIB #EQNLI
Step
30 ##¢0#- L *!!!!!!V0!!!!!+
Reference
Limited Warranty
W-2
Service
Europe Asia Pacific Country Telephone numbers
America Country Telephone numbers
Regulatory information
Federal Communications Commission Notice
Canadian Notice
Korean Notice