1.Position your cursor where you want the constant inserted.
2.Press [ 2nd ] [ CONST ] to display the physics constants menu.
3.Scroll through the menu until the constant you want is underlined.
4.Press [![]() ]. (See Example 34.)
]. (See Example 34.)
Multi-statement functions
When execution reaches the end of a statement that is followed by the display result command symbol (![]() ), execution stops and the result up to that point appears on the display. You can resume execution by pressing
), execution stops and the result up to that point appears on the display. You can resume execution by pressing
[![]() ]. See Example 35.
]. See Example 35.
Chapter 5 : Graphs
Built-in Function Graphs
You can produce graphs of the following functions: sin, cos, tan, sin
tan ![]() ,
,![]() , x 2 , x 3 , log, ln, 10 x, e x, x
, x 2 , x 3 , log, ln, 10 x, e x, x
When you generate a
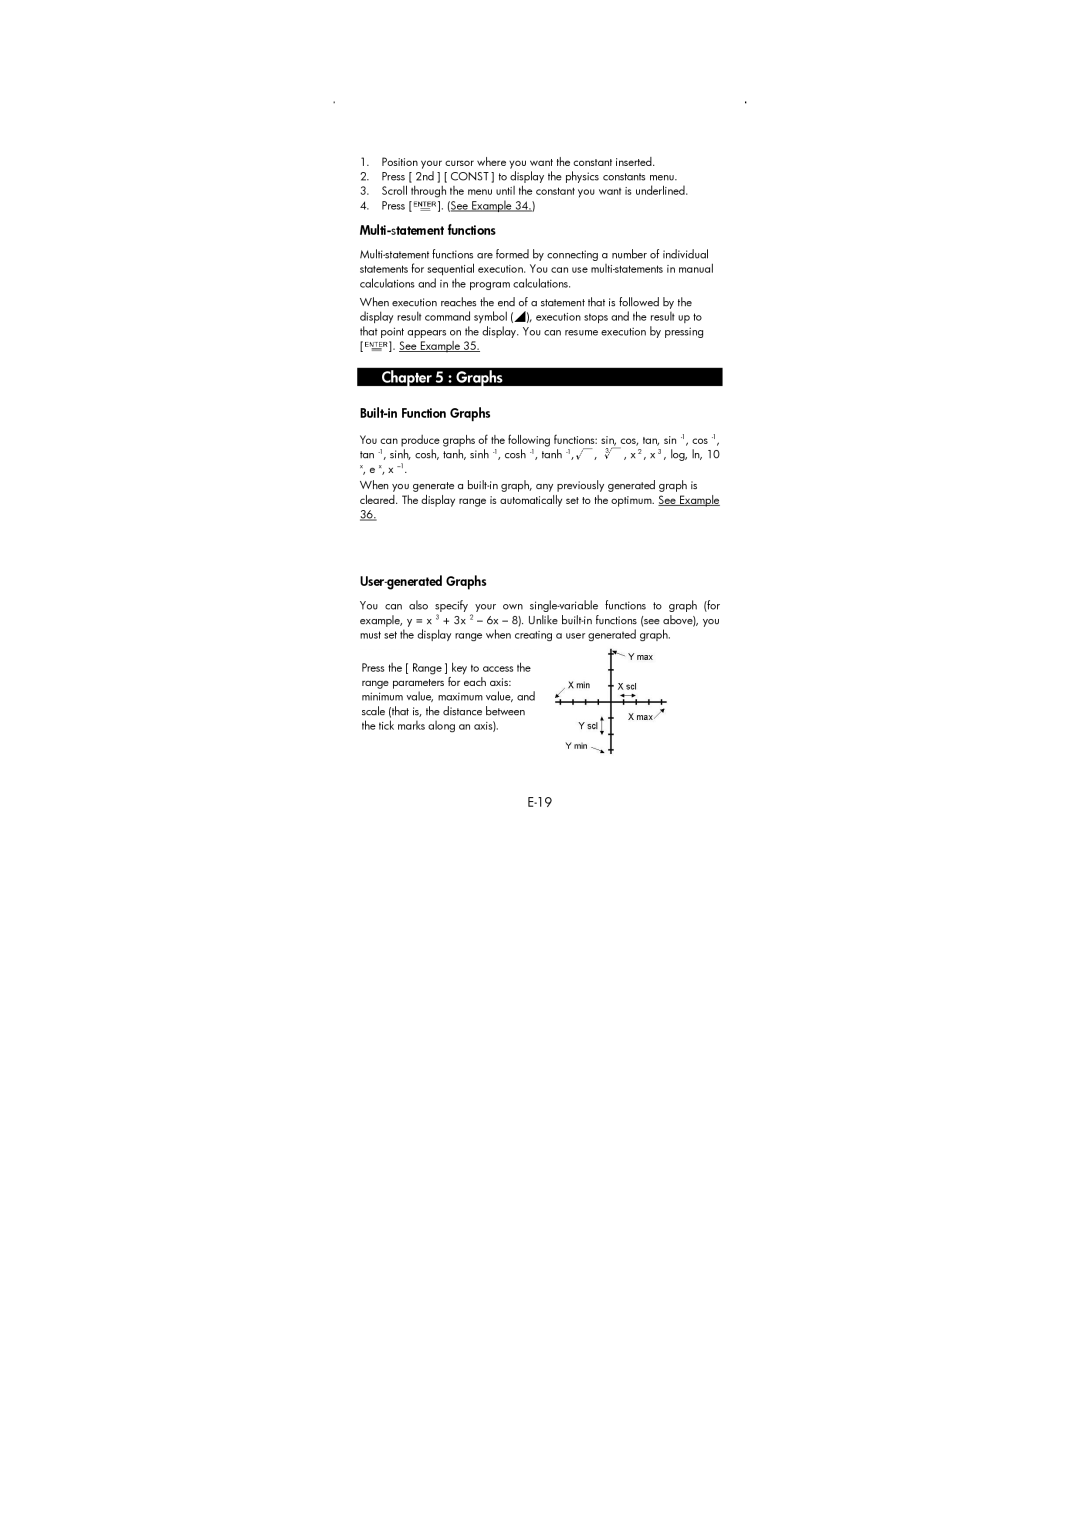
User-generated Graphs
You can also specify your own
Press the [ Range ] key to access the range parameters for each axis: minimum value, maximum value, and scale (that is, the distance between the tick marks along an axis).