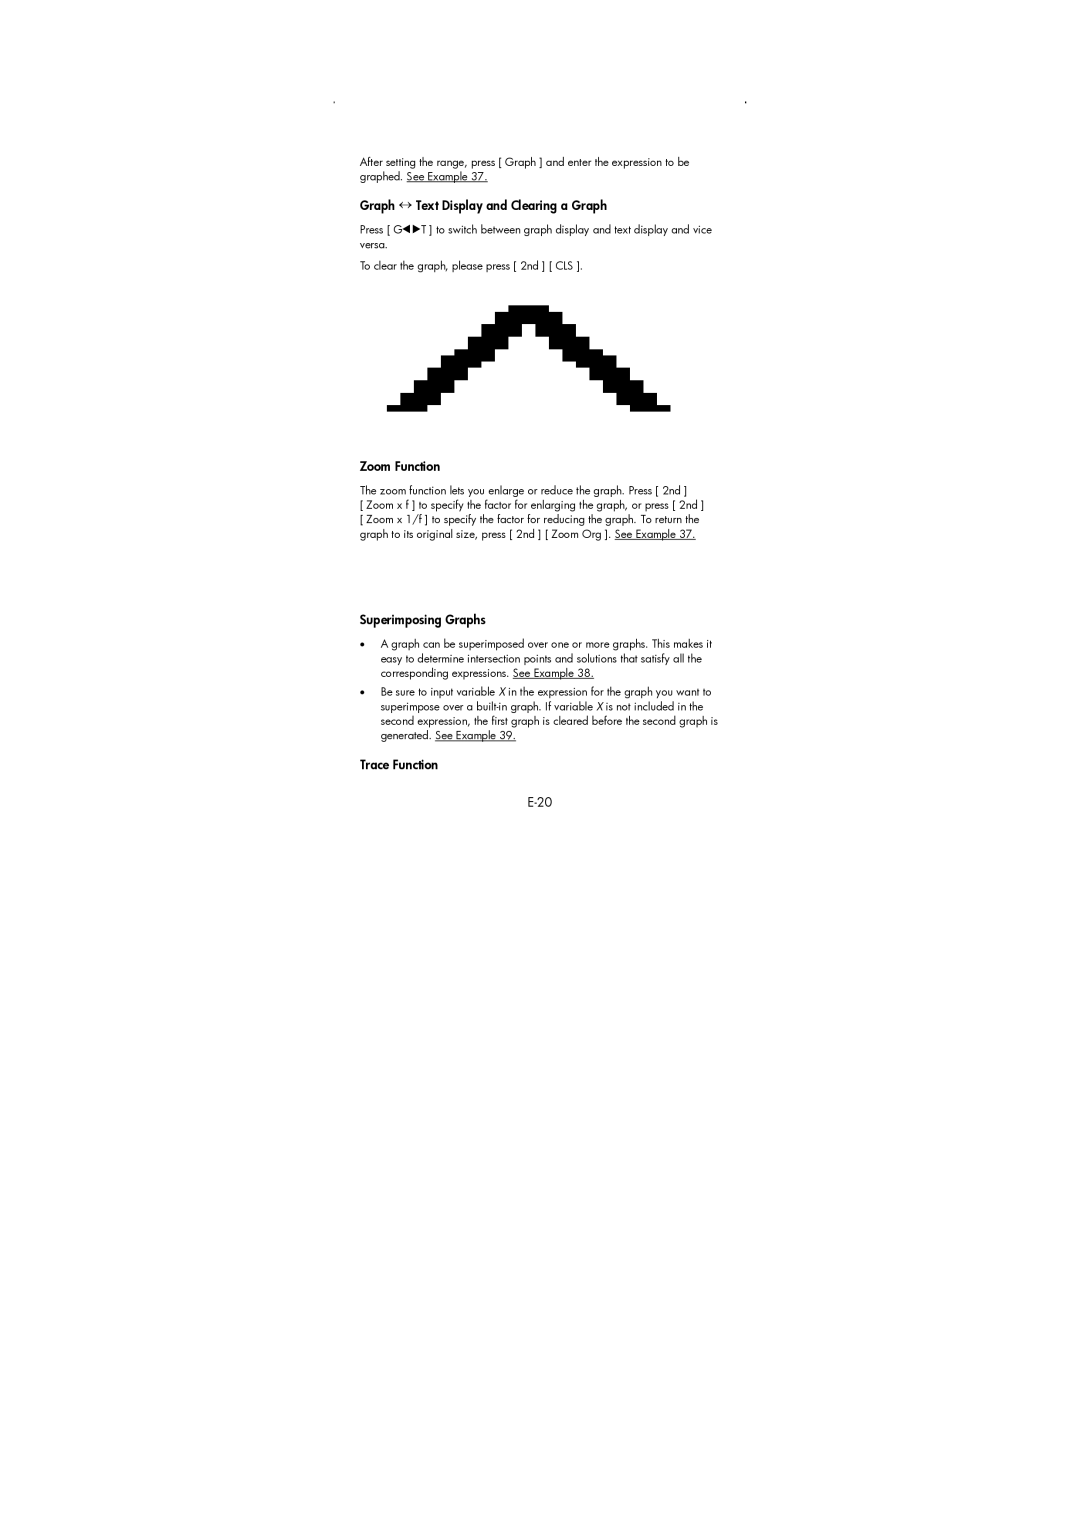
After setting the range, press [ Graph ] and enter the expression to be graphed. See Example 37.
Graph ↔ Text Display and Clearing a Graph
Press [ G![]() T ] to switch between graph display and text display and vice versa.
T ] to switch between graph display and text display and vice versa.
To clear the graph, please press [ 2nd ] [ CLS ].
Zoom Function
The zoom function lets you enlarge or reduce the graph. Press [ 2nd ]
[ Zoom x f ] to specify the factor for enlarging the graph, or press [ 2nd ] [ Zoom x 1/f ] to specify the factor for reducing the graph. To return the graph to its original size, press [ 2nd ] [ Zoom Org ]. See Example 37.
Superimposing Graphs
•A graph can be superimposed over one or more graphs. This makes it easy to determine intersection points and solutions that satisfy all the corresponding expressions. See Example 38.
•Be sure to input variable X in the expression for the graph you want to superimpose over a
