5.0 Debug settings and data collection tools
Several debug settings and data collection tools can help you debug a performance problem on systems using HPS. This section contains a subset of the most common setting changes and tools. If a performance problem persists after you check the debug settings and the data that was collected, call IBM service for assistance.
5.1 lsattr tuning
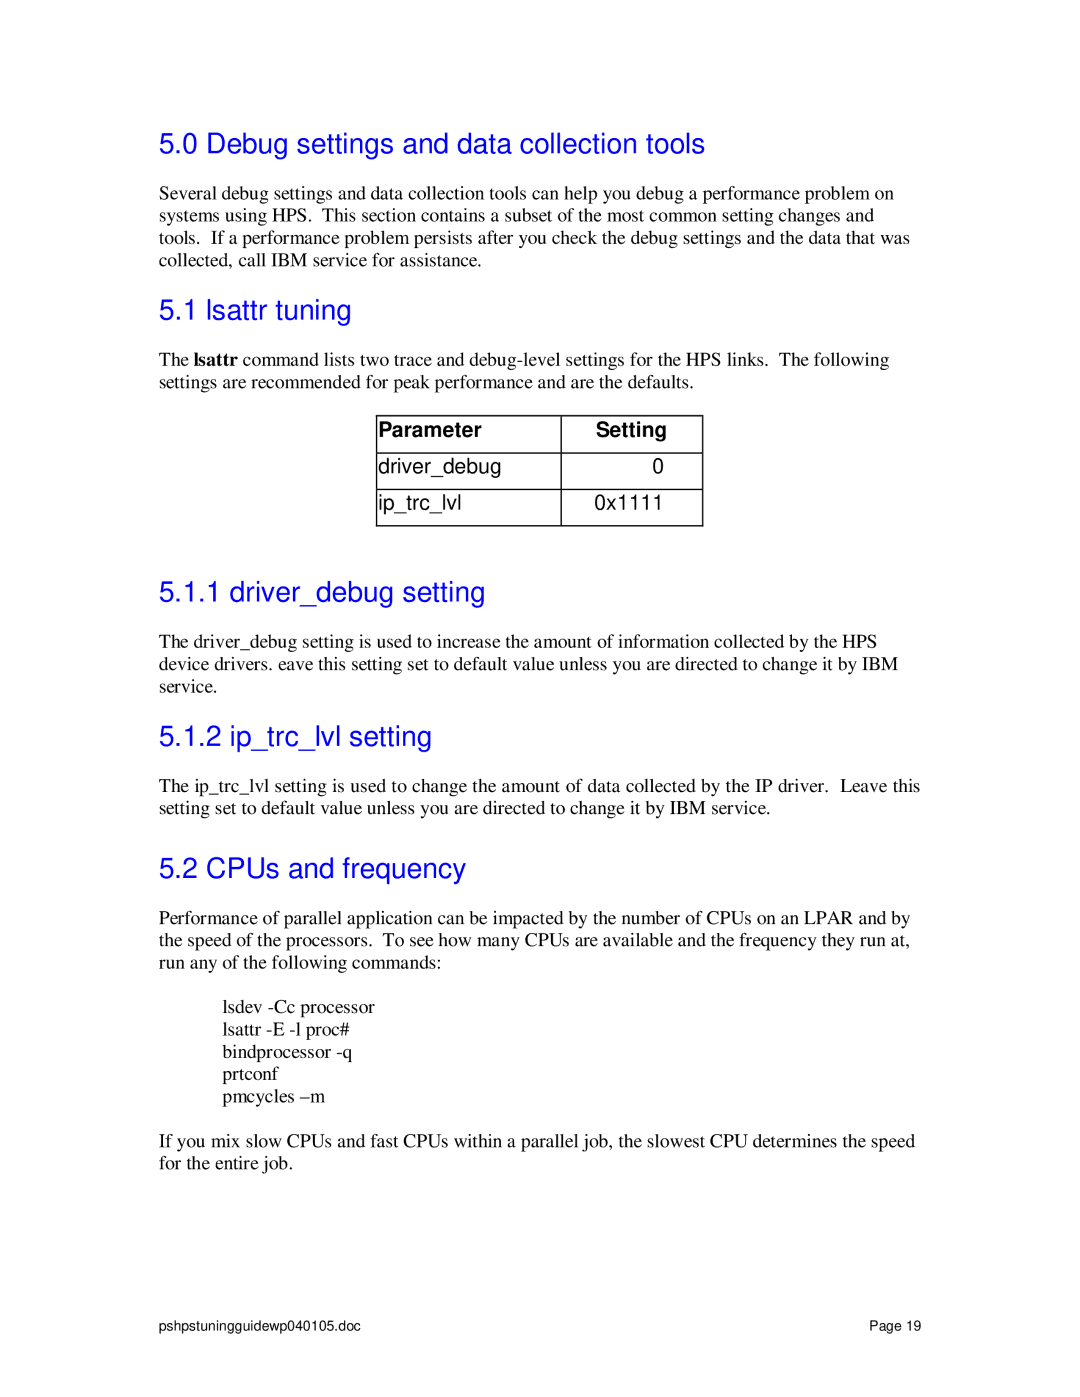
The lsattr command lists two trace and
Parameter | Setting |
|
|
driver_debug | 0 |
|
|
ip_trc_lvl | 0x1111 |
|
|
5.1.1 driver_debug setting
The driver_debug setting is used to increase the amount of information collected by the HPS device drivers. eave this setting set to default value unless you are directed to change it by IBM service.
5.1.2 ip_trc_lvl setting
The ip_trc_lvl setting is used to change the amount of data collected by the IP driver. Leave this setting set to default value unless you are directed to change it by IBM service.
5.2 CPUs and frequency
Performance of parallel application can be impacted by the number of CPUs on an LPAR and by the speed of the processors. To see how many CPUs are available and the frequency they run at, run any of the following commands:
lsdev
If you mix slow CPUs and fast CPUs within a parallel job, the slowest CPU determines the speed for the entire job.
pshpstuningguidewp040105.doc | Page 19 |
