PageSize | Inuse |
| Pin | Pgsp | Virtual |
|
|
|
|
| |
4KB | 448221 | 3687 | 2675 | 449797 |
|
|
|
|
| ||
16MB | 0 |
| 0 | 0 |
| 0 |
|
|
|
|
|
|
|
|
|
|
|
|
|
| |||
Vsid | Esid | Type Description |
| LPage | Inuse | Pin | Pgsp | Virtual | |||
1f187f | 11 | work text data BSS heap | - |
| 56789 | 0 | 0 | 56789 | |||
218a2 70000000 | work default shmat/mmap | - |
| 33680 | 0 | 0 | 33680 | ||||
131893 | 17 | work text data BSS heap | - |
| 21840 | 324 | 0 | 21840 | |||
0 | 0 | work kernel segment |
| - |
| 4902 3327 | 2563 | 6419 | |||
1118b1 8001000a |
| work private load |
| - |
| 1405 | 0 | 0 | 1405 | ||
d09ad 90000000 |
| work loader segment |
| - |
| 1039 | 0 | 42 | 1226 | ||
1611b6 90020014 |
| work shared library text | - |
| 169 | 0 | 65 | 194 | |||
31823 | 10 | clnt text data BSS heap | - |
| 145 | 0 | - | - | |||
1a187a | ffffffff |
| work application stack | - |
| 50 | 0 | 0 | 50 | ||
c17ec f00000002 |
| work process private |
| - |
| 31 | 22 | 0 | 31 | ||
b11ab | 9fffffff |
| pers shared library text, | - | 10 | 0 | - | - | |||
3.3.2 vmstat
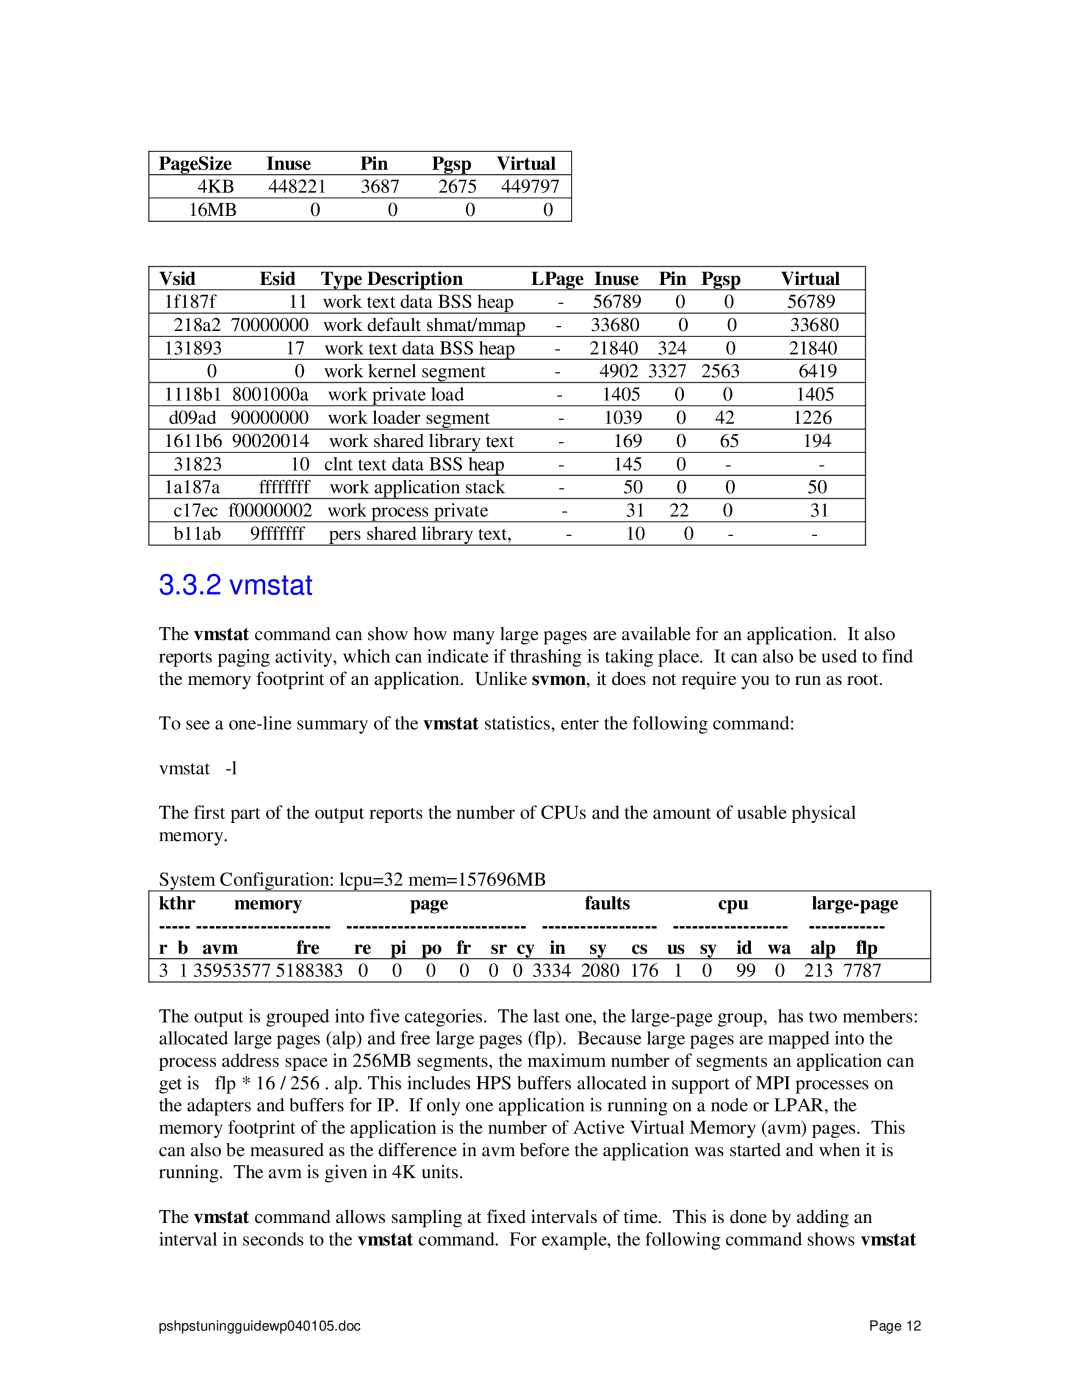
The vmstat command can show how many large pages are available for an application. It also reports paging activity, which can indicate if thrashing is taking place. It can also be used to find the memory footprint of an application. Unlike svmon, it does not require you to run as root.
To see a
vmstat
The first part of the output reports the number of CPUs and the amount of usable physical memory.
System Configuration: lcpu=32 mem=157696MB
kthr | memory |
|
| page |
|
|
|
|
| faults |
|
| cpu |
| ||||||
|
| |||||||||||||||||||
r | b |
| avm | fre | re | pi | po | fr | sr cy | in | sy | cs | us | sy | id | wa | alp | flp | ||
3 | 1 | 35953577 5188383 | 0 | 0 | 0 | 0 | 0 | 0 | 3334 | 2080 | 176 | 1 | 0 | 99 | 0 | 213 | 7787 | |||
The output is grouped into five categories. The last one, the
The vmstat command allows sampling at fixed intervals of time. This is done by adding an interval in seconds to the vmstat command. For example, the following command shows vmstat
pshpstuningguidewp040105.doc | Page 12 |
