5.16 AIX 5L trace for daemon activity
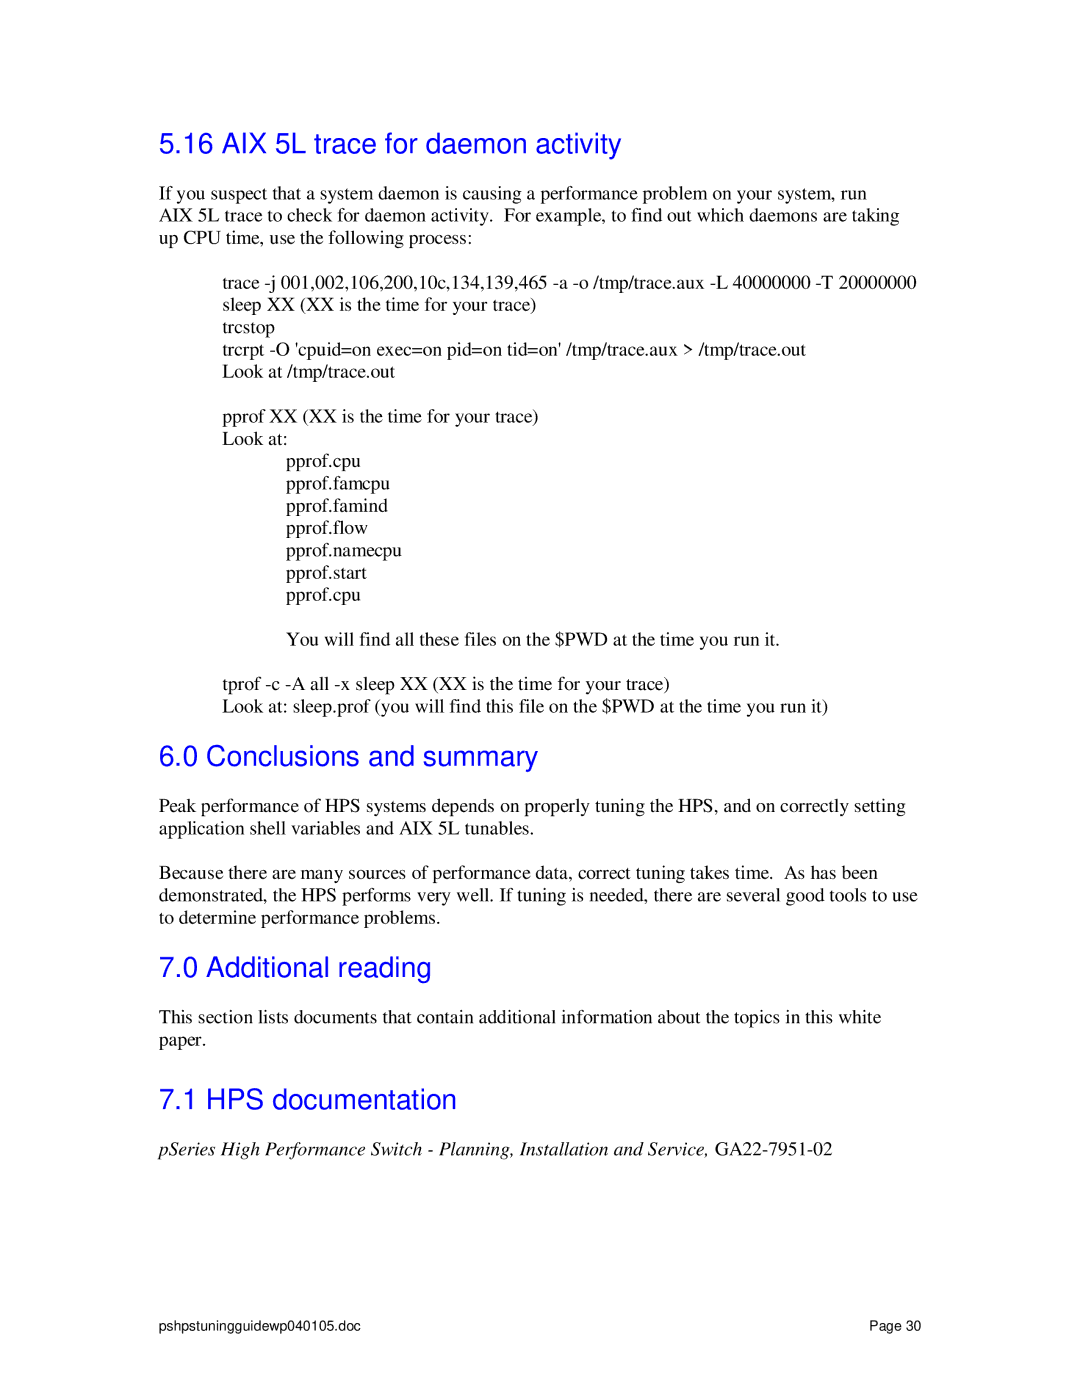
If you suspect that a system daemon is causing a performance problem on your system, run AIX 5L trace to check for daemon activity. For example, to find out which daemons are taking up CPU time, use the following process:
trace
trcstop
trcrpt
pprof XX (XX is the time for your trace) Look at:
pprof.cpu
pprof.famcpu
pprof.famind
pprof.flow
pprof.namecpu
pprof.start
pprof.cpu
You will find all these files on the $PWD at the time you run it.
tprof
Look at: sleep.prof (you will find this file on the $PWD at the time you run it)
6.0 Conclusions and summary
Peak performance of HPS systems depends on properly tuning the HPS, and on correctly setting application shell variables and AIX 5L tunables.
Because there are many sources of performance data, correct tuning takes time. As has been demonstrated, the HPS performs very well. If tuning is needed, there are several good tools to use to determine performance problems.
7.0 Additional reading
This section lists documents that contain additional information about the topics in this white paper.
7.1 HPS documentation
pSeries High Performance Switch - Planning, Installation and Service,
pshpstuningguidewp040105.doc | Page 30 |
