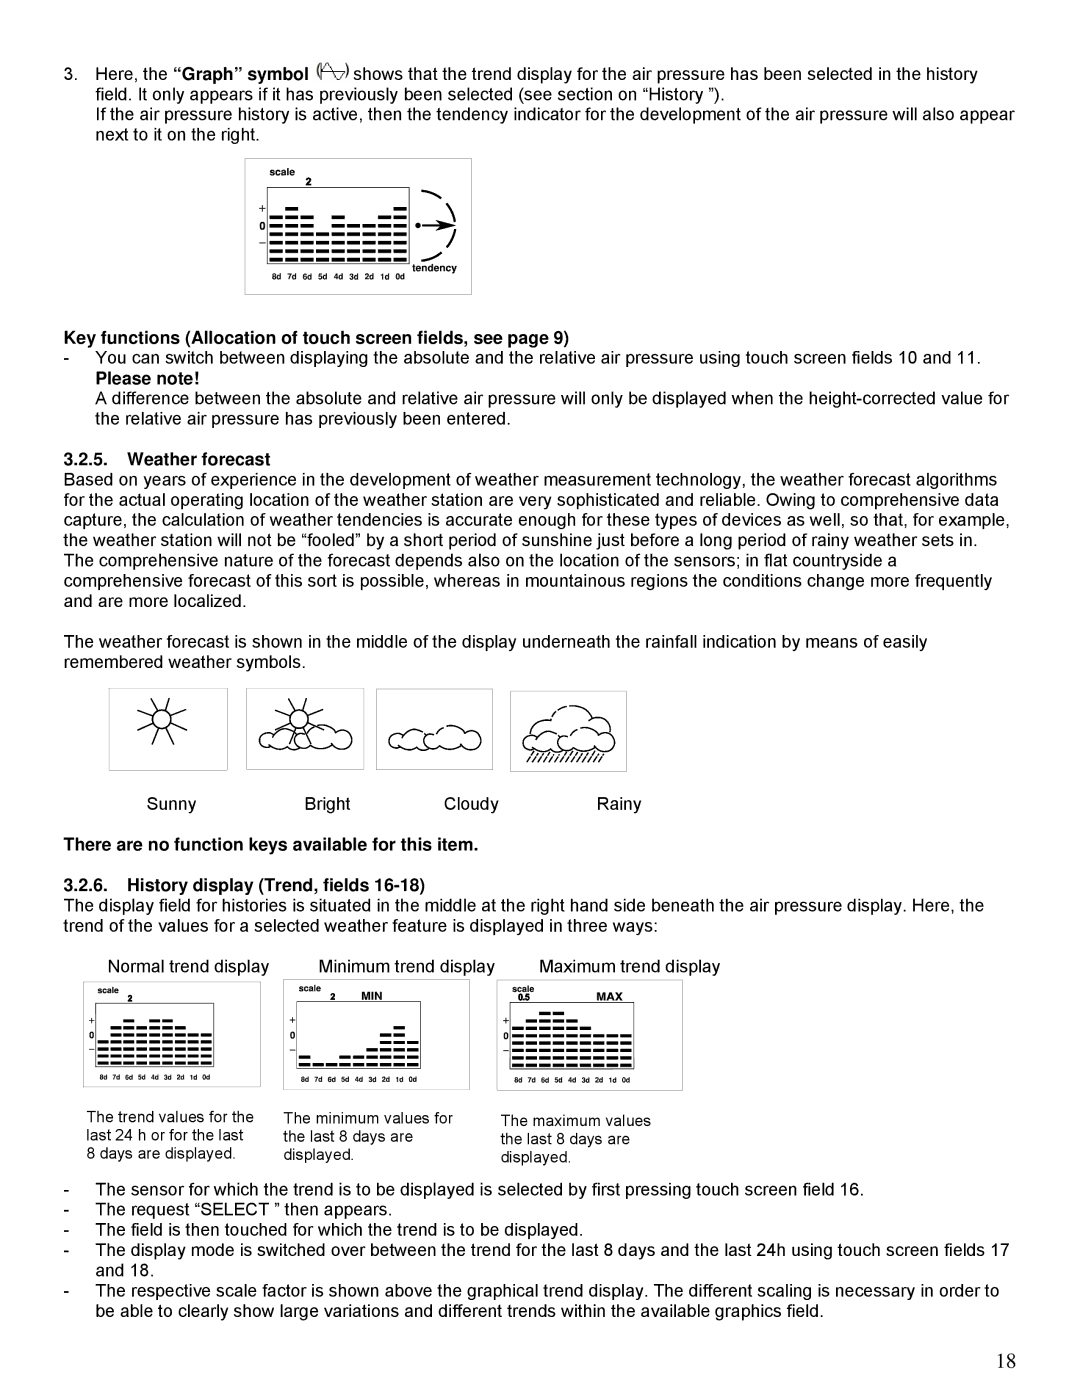
3.Here, the “Graph” symbol shows that the trend display for the air pressure has been selected in the history field. It only appears if it has previously been selected (see section on “History ”).

If the air pressure history is active, then the tendency indicator for the development of the air pressure will also appear next to it on the right.

Key functions (Allocation of touch screen fields, see page 9)

-You can switch between displaying the absolute and the relative air pressure using touch screen fields 10 and 11.

Please note!

A difference between the absolute and relative air pressure will only be displayed when the height-corrected value for the relative air pressure has previously been entered.

3.2.5.Weather forecast

Based on years of experience in the development of weather measurement technology, the weather forecast algorithms for the actual operating location of the weather station are very sophisticated and reliable. Owing to comprehensive data capture, the calculation of weather tendencies is accurate enough for these types of devices as well, so that, for example, the weather station will not be “fooled” by a short period of sunshine just before a long period of rainy weather sets in. The comprehensive nature of the forecast depends also on the location of the sensors; in flat countryside a comprehensive forecast of this sort is possible, whereas in mountainous regions the conditions change more frequently and are more localized.

The weather forecast is shown in the middle of the display underneath the rainfall indication by means of easily remembered weather symbols.

Sunny

Bright

Cloudy

Rainy

There are no function keys available for this item.

3.2.6.History display (Trend, fields 16-18)

The display field for histories is situated in the middle at the right hand side beneath the air pressure display. Here, the trend of the values for a selected weather feature is displayed in three ways:


Normal trend display


Minimum trend display


Maximum trend display


The trend values for the last 24 h or for the last 8 days are displayed.

The minimum values for the last 8 days are displayed.

The maximum values the last 8 days are displayed.

-The sensor for which the trend is to be displayed is selected by first pressing touch screen field 16.

-The request “SELECT ” then appears.

-The field is then touched for which the trend is to be displayed.

-The display mode is switched over between the trend for the last 8 days and the last 24h using touch screen fields 17 and 18.

-The respective scale factor is shown above the graphical trend display. The different scaling is necessary in order to be able to clearly show large variations and different trends within the available graphics field.

18

Page 18
Image 18
La Crosse Technology WS-2510 manual Weather forecast

WS-2510 specifications

The La Crosse Technology WS-2510 is a versatile weather station designed for those who want to keep an eye on environmental conditions from the comfort of their own homes. With its sleek design and user-friendly interface, the WS-2510 provides a wealth of data about local weather conditions at a glance.

One of the primary features of the WS-2510 is its accurate and reliable weather monitoring capabilities. The station measures indoor and outdoor temperatures, humidity levels, wind speed, and rainfall. This comprehensive monitoring system allows users to gain valuable insights into current weather patterns, making it easier to plan outdoor activities or simply understand changing climatic conditions.

Equipped with wireless technology, the WS-2510 transmits data from the outdoor sensor to the indoor display unit without the need for messy cables, allowing for easy installation and positioning of the sensor. This feature enhances the convenience of real-time monitoring, as users can place the outdoor unit in the optimal location for accurate readings.

The WS-2510 is also notable for its multifunctional display. The indoor console features a large, easy-to-read LCD screen that showcases critical weather information in a clear format. Moreover, it includes trend indicators that display historical data, helping users track changes over time. The display updates frequently, ensuring that the information presented is current and useful.

In terms of technology, the WS-2510 utilizes advanced sensors for temperature, humidity, and wind measurements, ensuring high accuracy. It also uses a robust wireless communication protocol that provides a reliable connection between the outdoor and indoor units.

Another attractive feature of the WS-2510 is its ability to store data over time. Users can review past weather conditions, which is especially beneficial for those interested in tracking patterns, such as seasonal changes or anomalies. The data storage function allows for a more nuanced understanding of local climate trends.

For enthusiasts and professionals alike, the La Crosse Technology WS-2510 provides a cost-effective, reliable solution for weather monitoring. Its blend of advanced technology, user-friendly features, and sleek design makes it an appealing choice for anyone looking to bring the power of meteorological data into their home. With the WS-2510, monitoring local weather has never been easier or more engaging.